In this section
M365 IR: First KQL, PowerShell, and UAL Investigation Queries
Time to run something
Four sections of theory. Now you run your first investigation queries against a real M365 environment. If you completed the toolkit setup in Section 0.5, you're ready. If you have access to Sentinel or Defender XDR Advanced Hunting, run the KQL queries. If you have PowerShell configured with Microsoft.Graph and ExchangeOnlineManagement, run the collection commands. Seeing your own environment's data is the fastest way to understand what these tools show you and what they miss.
Everything in this section is a preview. Module 4 teaches the formal investigation methodology. Module 5 teaches forensic analysis in depth. What you do here is the equivalent of picking up the tools, checking they work, and getting a feel for what an investigation looks like before the structured training begins.
Your first KQL query: who signed in and from where
Open the Sentinel Logs blade or Defender XDR Advanced Hunting. Paste this query and run it:
SigninLogs
| where TimeGenerated > ago(24h)
| where ResultType == "0"
| summarize SignInCount = count() by UserPrincipalName, IPAddress, Location
| sort by SignInCount desc
| take 20
This asks: which users successfully signed in during the last 24 hours, from which IPs, and from which locations? Each row in the output is a unique combination of user, IP, and location. In a healthy environment, the top rows are your most active users signing in from expected corporate IPs and expected locations.
The investigation value is in what doesn't fit. Look at your results and ask yourself: do you recognise every IP address? Are there locations where your organization has no offices or remote workers? Is any user appearing from two different countries within the same 24-hour window? You might not find anything unusual. That's fine. You've just run the same query that an IR analyst runs in the first five minutes of every identity investigation.
Now look at the failures. Failed sign-ins are the fingerprints of credential attacks:
SigninLogs
| where TimeGenerated > ago(24h)
| where ResultType != "0"
| summarize FailedCount = count() by UserPrincipalName, IPAddress, ResultType
| sort by FailedCount desc
| take 20If you see hundreds of 50126 failures from a single IP scattered across dozens of usernames, you're looking at a live password spray. That IP is probing your tenant right now. It's almost certainly automated, running through a list of harvested email addresses with common passwords. If you see a 50076 followed by a 0 from a different IP for the same user, something more interesting happened: the attacker failed MFA from their infrastructure, then succeeded from a different location. That pattern is worth investigating. Module 4 teaches you how.
Reading a sign-in record: the 12 fields that matter
Every sign-in event in M365 produces a structured record with dozens of fields. Most of them don't matter for investigation. Twelve of them matter for every investigation. Pull a single successful sign-in and look at it:
SigninLogs
| where TimeGenerated > ago(1h)
| where ResultType == "0"
| take 1
| project TimeGenerated, UserPrincipalName, IPAddress, Location,
    AppDisplayName, ClientAppUsed, DeviceDetail,
    ConditionalAccessStatus, MfaDetail, RiskLevelDuringSignIn,
    AuthenticationRequirement, IsInteractive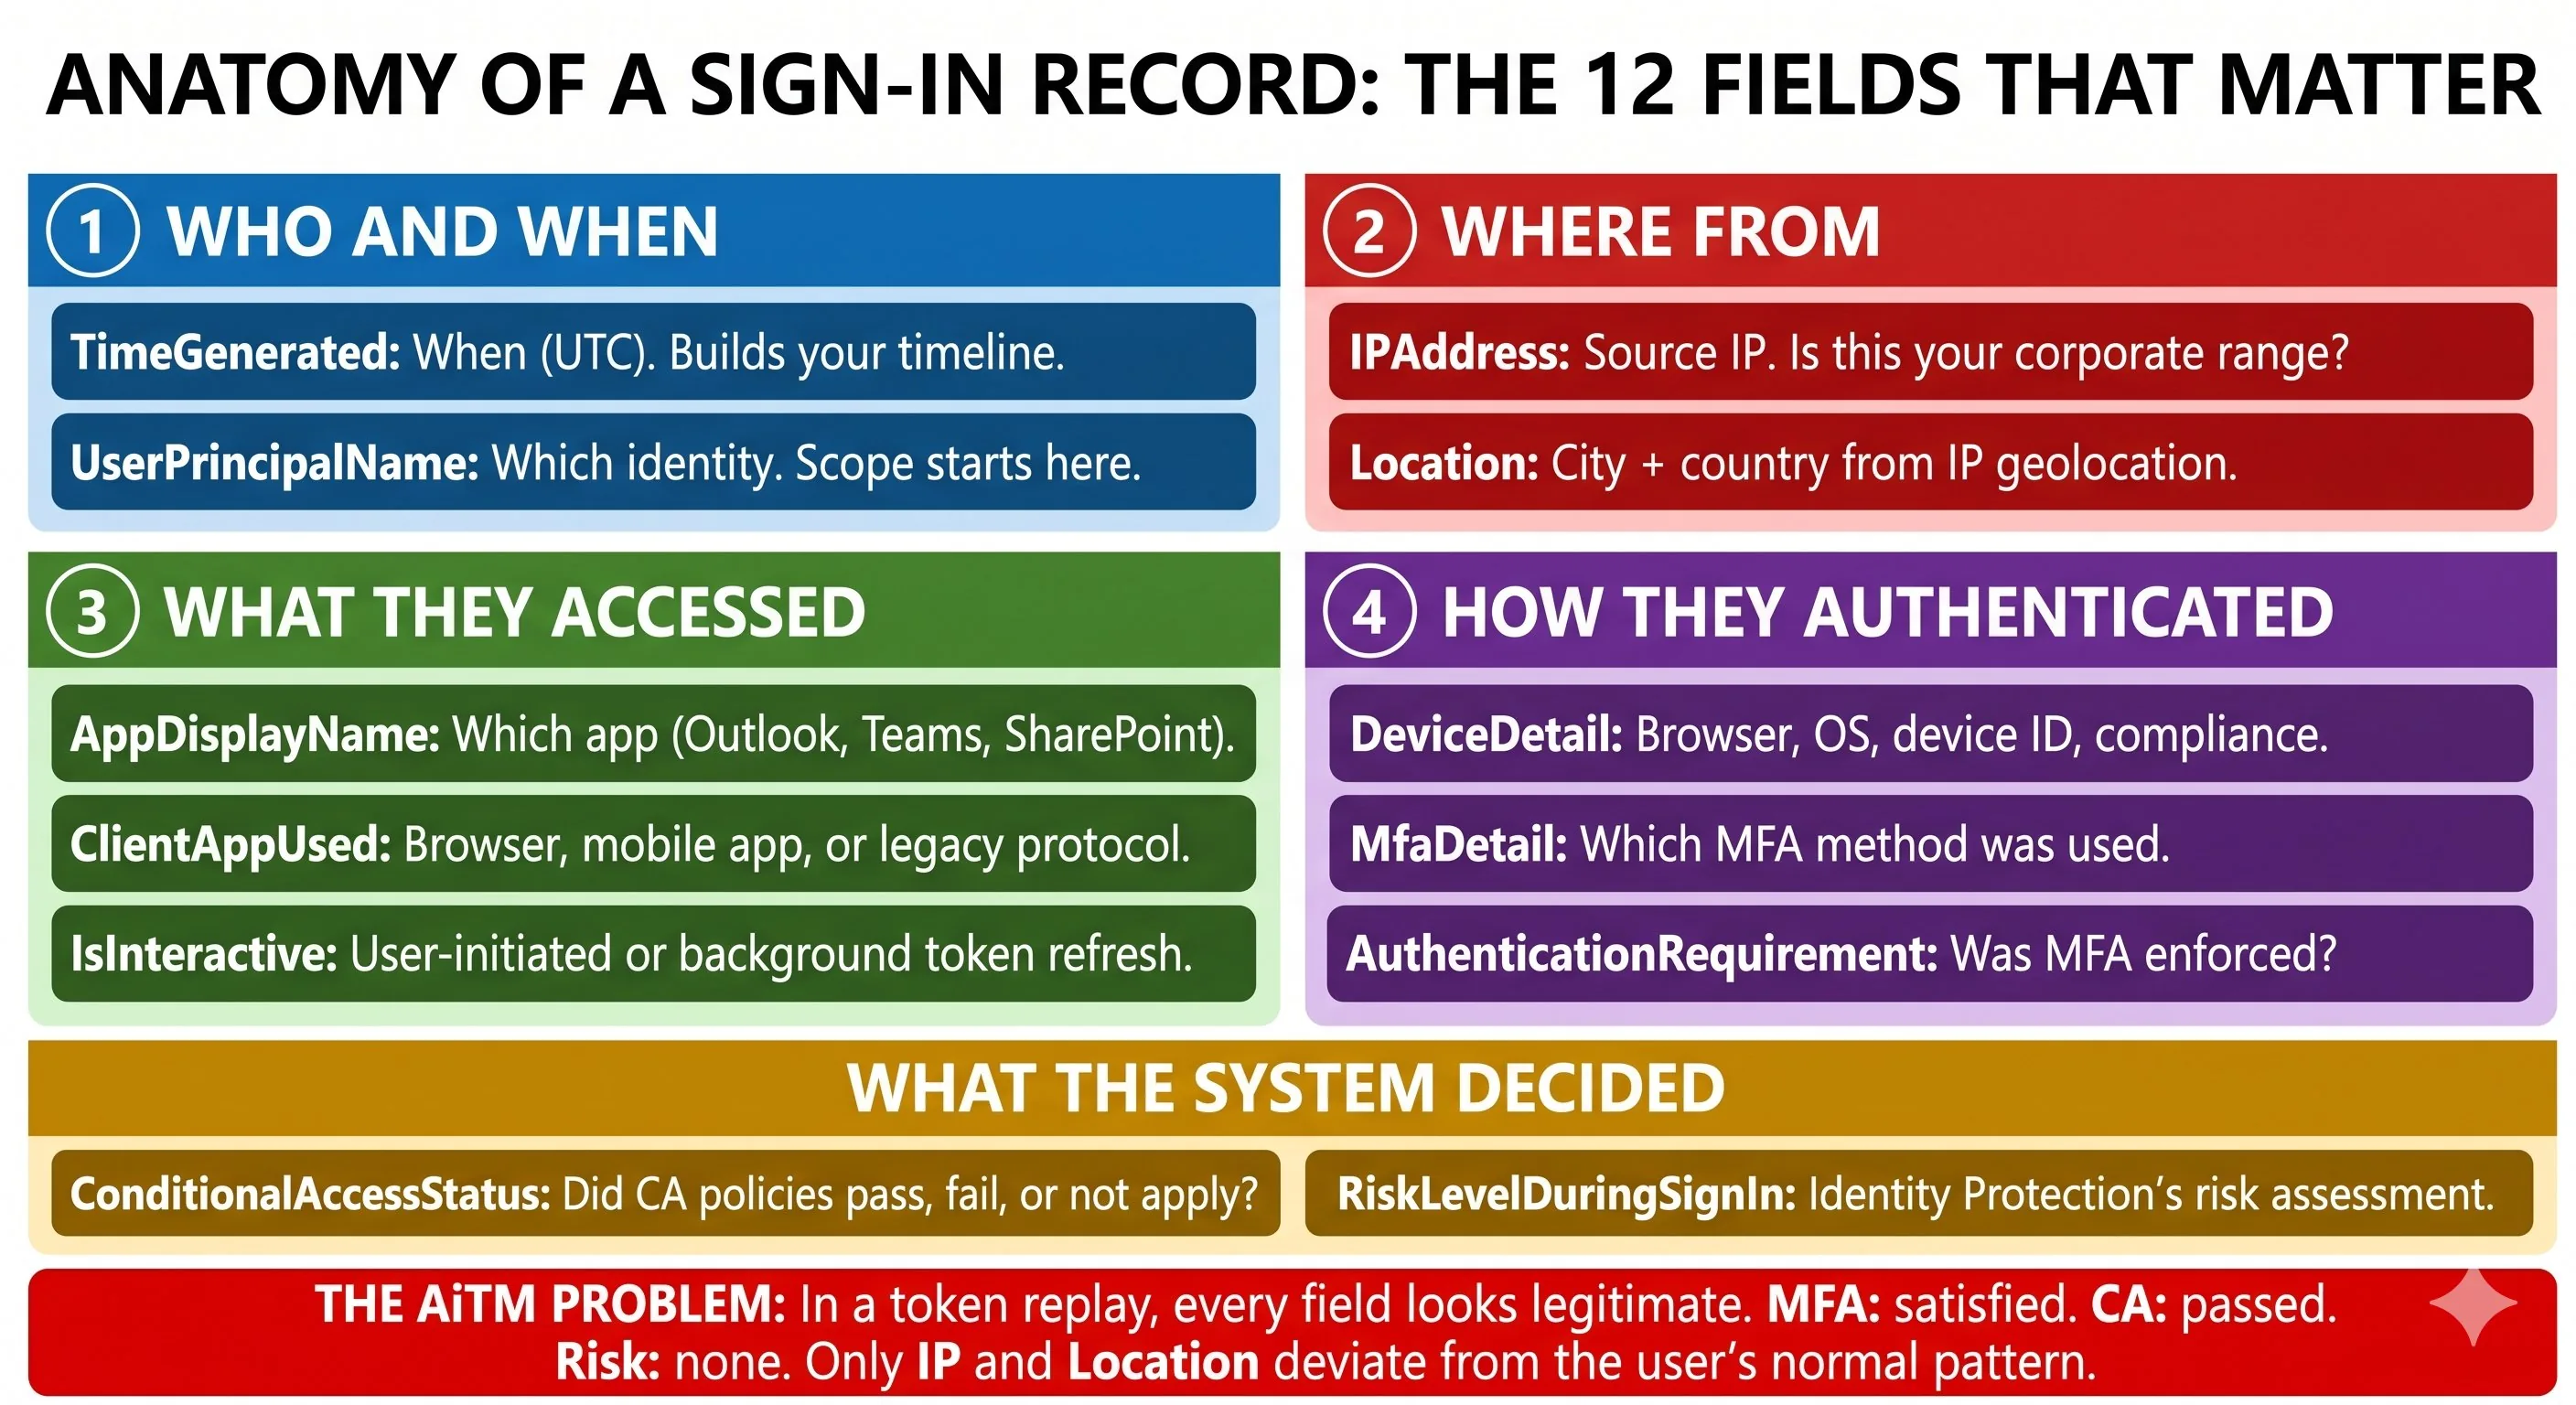
Every investigation in this course starts with these 12 fields. The sign-in record is the first piece of evidence you examine. Before you query email, before you check file access, before you look at directory changes, you look at the sign-in. Who authenticated, from where, with what, and what did the system decide about it. Module 5 teaches you to read these records at forensic depth. Right now, make sure you can pull one and understand what the fields mean.
Your first PowerShell evidence collection
KQL queries data that Sentinel has ingested. PowerShell collects evidence directly from M365 through the Graph API. You use PowerShell when Sentinel isn't available, when you need to export evidence for preservation, or when you need data that Sentinel doesn't ingest.
Pull the last 50 sign-in events for a specific user:
# Replace with a real user in your tenant
$user = "user@yourdomain.com"
# Pull recent sign-ins via Graph API
$signIns = Get-MgAuditLogSignIn -Filter "userPrincipalName eq '$user'" `
    -Top 50 -Sort "createdDateTime DESC"
# Display investigation-relevant fields
$signIns | Select-Object CreatedDateTime, IpAddress,
    @{N='City';E={$_.Location.City}},
    @{N='Country';E={$_.Location.CountryOrRegion}},
    AppDisplayName,
    @{N='CA';E={$_.ConditionalAccessStatus}},
    @{N='Risk';E={$_.RiskLevelDuringSignIn}} |
    Format-Table -AutoSize
The output is a table of the user's recent sign-ins with the key investigation fields. Compare what you see to what you'd expect. Is every sign-in from a location you recognise? Is the Conditional Access status "success" for every row, or are some "notApplied"? A "notApplied" status means the user signed into an application that your CA policies don't cover. That's a gap worth knowing about before an incident exploits it.
For evidence preservation during an actual incident, export to JSON. JSON preserves the full nested structure (DeviceDetail, Location, and AuthenticationDetails are nested objects that CSV flattens and loses):
# Export complete sign-in data for evidence preservation
$signIns | ConvertTo-Json -Depth 10 |
    Out-File "C:\IR\Evidence\$($user.Replace('@','_'))_signins.json"
This is the same export you'll run in the first 15 minutes of a real incident. The difference is that during an incident, you're racing the 30-day sign-in log retention clock. If the compromise started 28 days ago and you don't export now, you have two days before the initial access evidence disappears. Module 4 teaches the evidence preservation sequence. Module 5 teaches forensic analysis of what you've collected. For now, confirm the command works and you can export data from your tenant.
Your first UAL search: the broadest evidence source
The Unified Audit Log captures activity across the entire M365 platform. It's usually the first evidence source an investigator queries because it covers the broadest range of operations: email, files, directory changes, Teams, Power Platform, and more.
Search the UAL for a specific user's activity in the last 7 days and summarize it by operation type:
# Search UAL for recent activity
$user = "user@yourdomain.com"
$results = Search-UnifiedAuditLog -StartDate (Get-Date).AddDays(-7) `
    -EndDate (Get-Date) -UserIds $user -ResultSize 100
# Summarize by operation type
$results | Group-Object Operations |
    Sort-Object Count -Descending |
    Select-Object Count, Name |
    Format-Table -AutoSize
A normal user generates a predictable activity pattern: mostly email access, some file operations, occasional Teams activity. The Group-Object summary surfaces that pattern instantly. You don't need to read 100 individual records. The summary tells you what this user's normal week looks like.
Now think about what an attacker's activity pattern looks like after compromising the same account. Instead of the normal pattern, you might see:
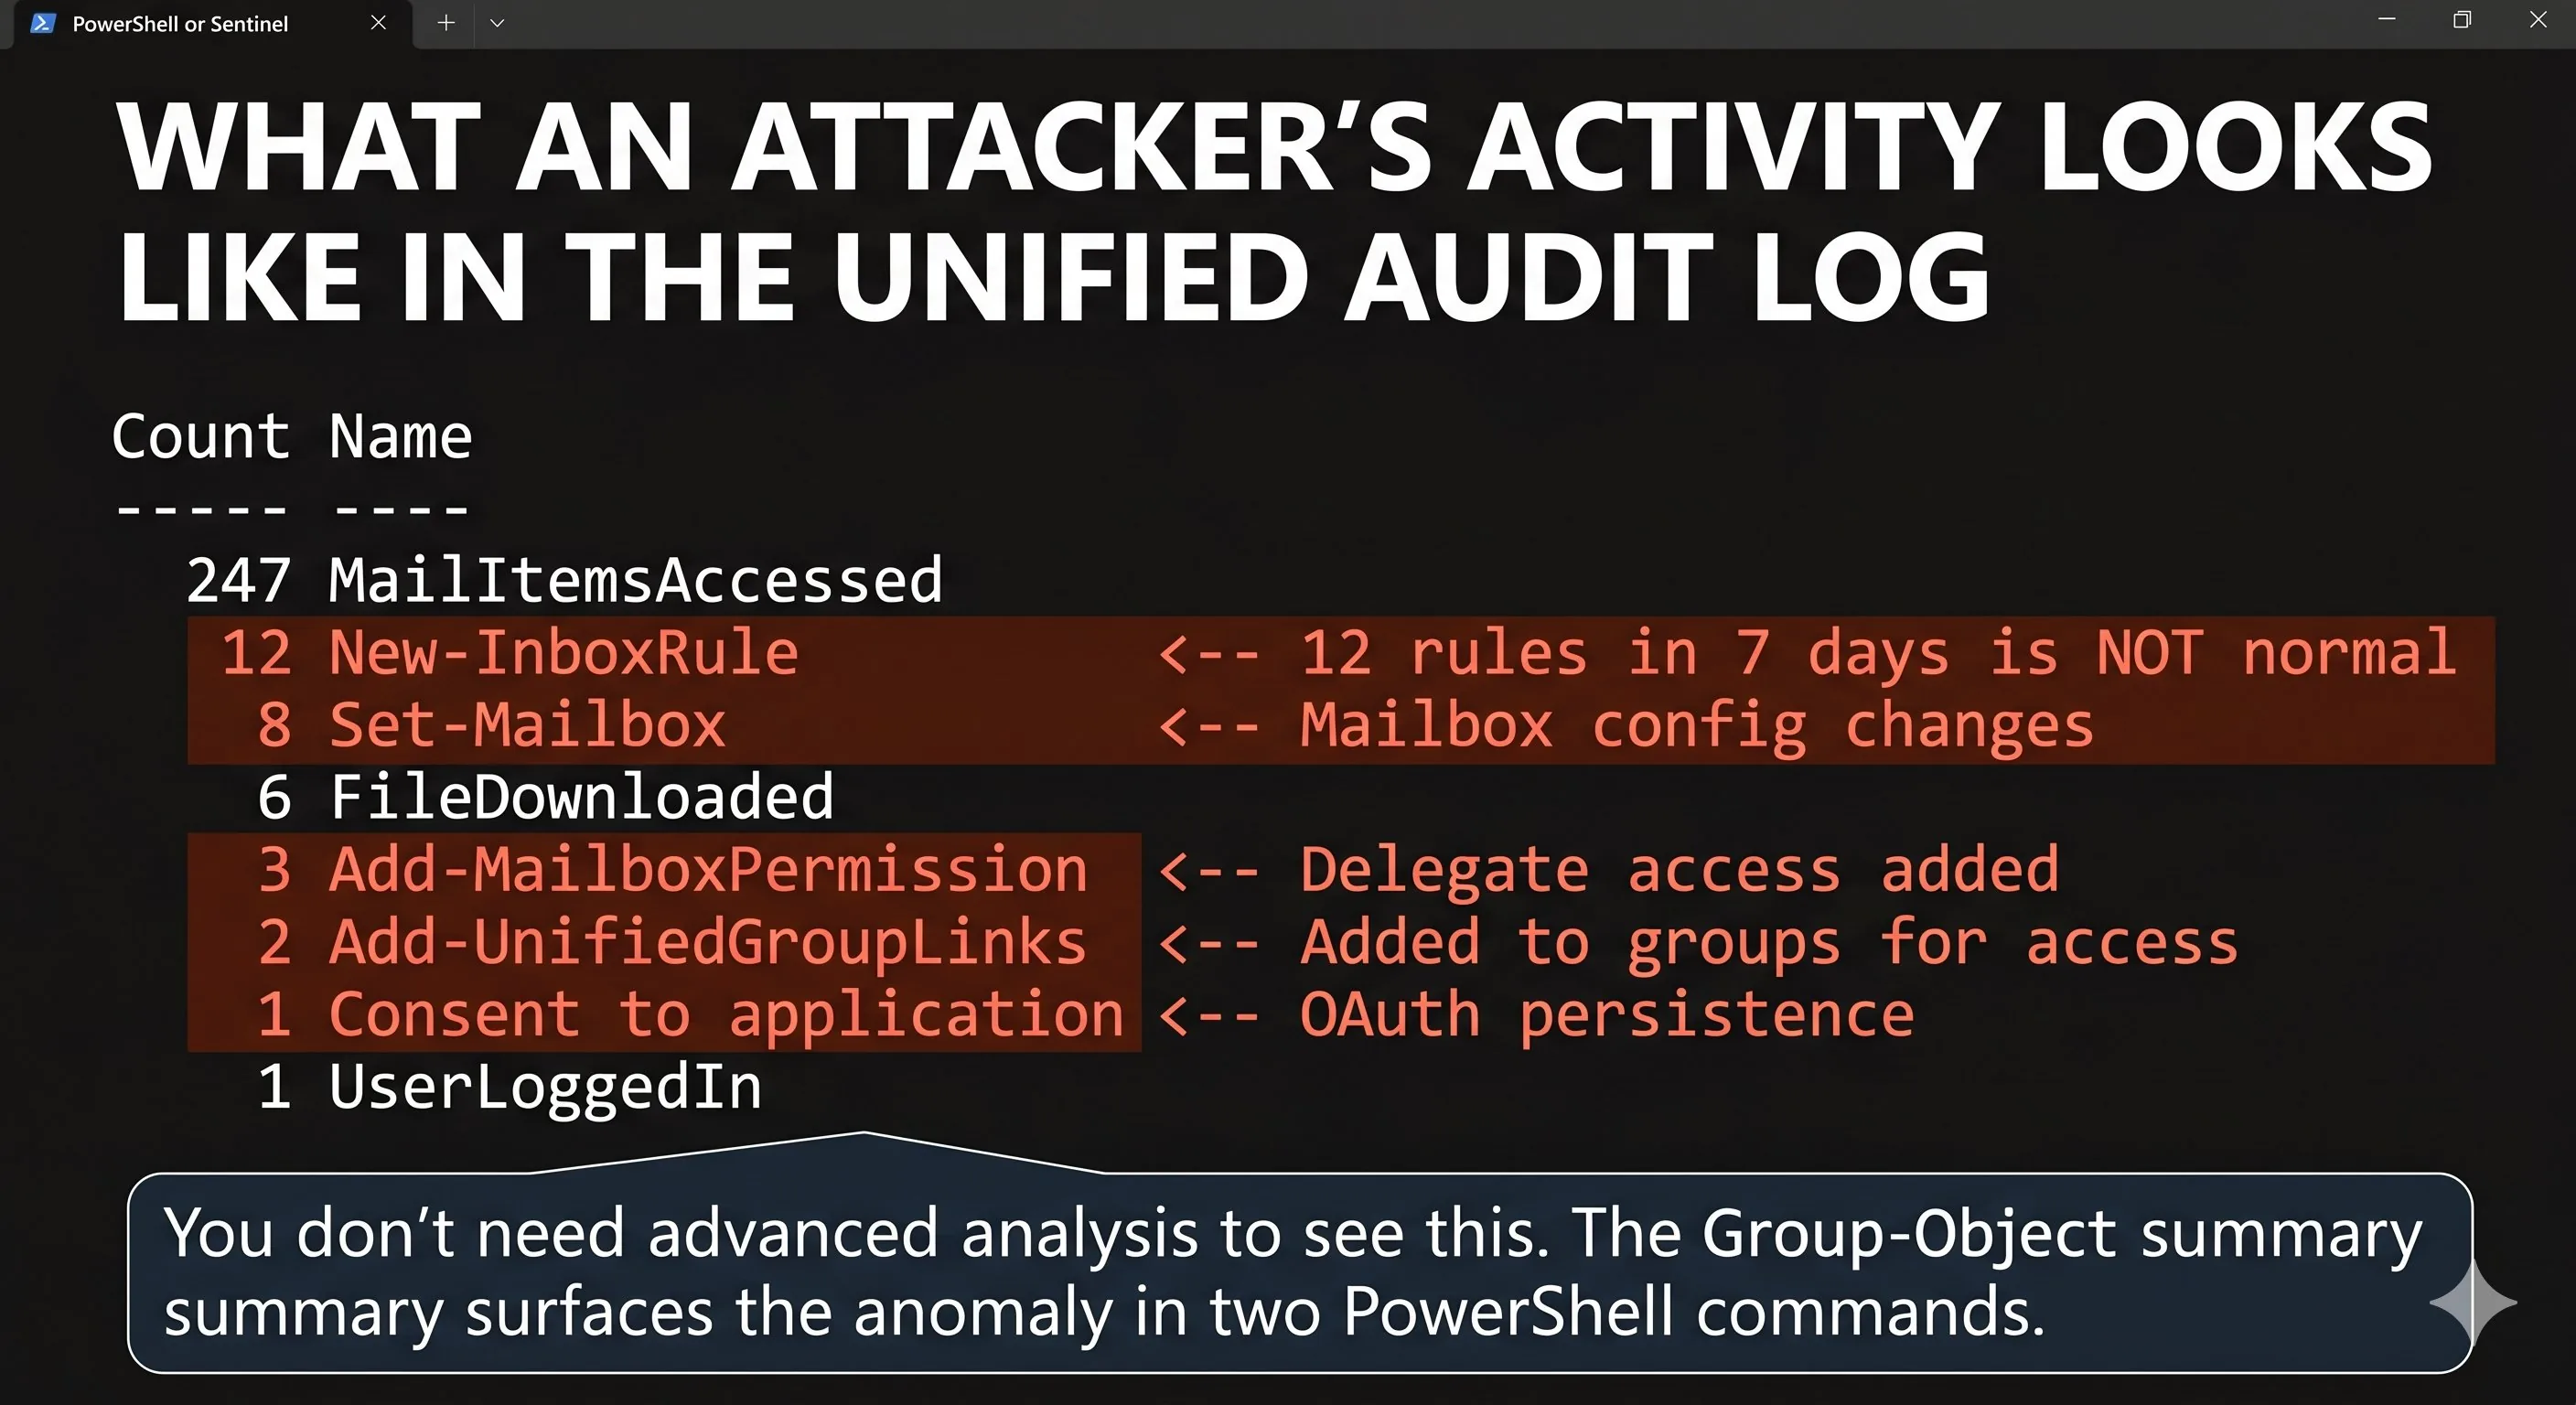
You don't need advanced analysis to see this. Twelve inbox rules created in a week is not normal behaviour. Eight mailbox configuration changes is not normal. Three delegate permission additions is not normal. An OAuth application consent that the user doesn't recognise is a persistence mechanism. The Group-Object summary surfaces all of this in two PowerShell commands. You're not yet analyzing the detail of each operation. That's Module 5. You're looking at the shape of the activity and asking: does this look right?
What you just did
In four exercises, you accomplished more investigation work than most organizations complete in the first hour of an incident. You queried 24 hours of sign-in activity across your entire tenant and looked for anomalies. You examined the structure of a sign-in record and understand what each of the 12 key fields means for investigation. You collected sign-in evidence through the Graph API and exported it to JSON for preservation. You searched the broadest M365 evidence source and identified what an attacker's activity pattern looks like compared to normal behaviour.
The Knowledge Check for this module tests whether you've internalized the foundations: shared responsibility, the threat landscape, framework application, regulatory obligations, and the evidence sources you just queried. Complete it before moving to Module 2.