In this section
ES8.2 MDE Advanced Hunting Tables
The previous section covered custom detections in mde vs sentinel. This section covers mde advanced hunting tables.
Figure ES8.2. Seven MDE Advanced Hunting tables. Each captures a different event category with specific key fields for detection engineering. Process events are the foundation, most detections start here and join to other tables for context.
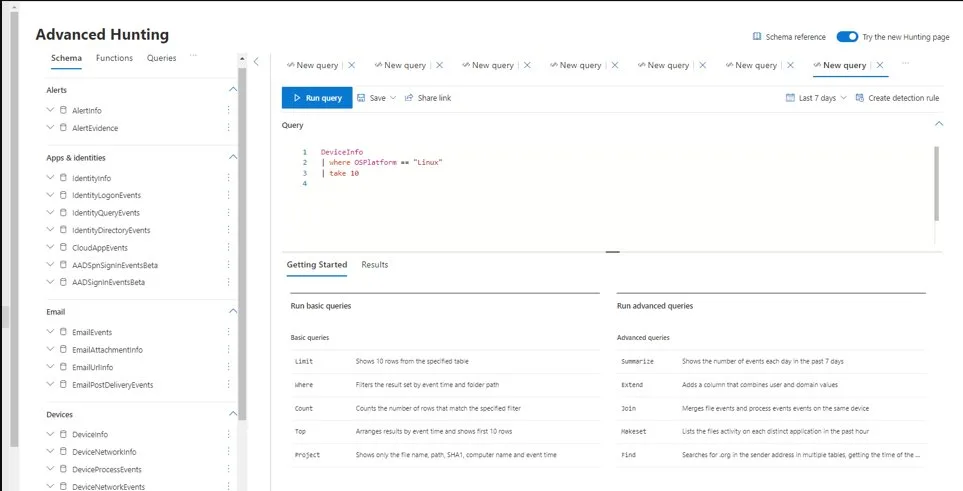
Figure ES8.2a. The Advanced Hunting interface in Defender XDR. The schema tree (left) shows tables for endpoint hunting: DeviceInfo, DeviceProcessEvents, DeviceNetworkEvents under Devices, plus Email and Identity tables for cross-workload queries. The query editor runs KQL queries against these tables. The Getting Started panel shows operators (limit, where, summarize, extend, join): the building blocks for every detection and hunting query in ES8 and ES9.
DeviceProcessEvents: the detection foundation
DeviceProcessEvents is the most important table for endpoint detection engineering. Every tool the attacker runs, every script they execute, every binary they launch generates a process creation event in this table. The key fields:
Anti-Pattern
Configuring without validating
The mde advanced hunting tables configuration is deployed based on documentation or vendor guidance, but nobody verifies it works in your environment. Deploy, then validate with a test that confirms the expected behavior. Every configuration has a verification query or test procedure, if you cannot verify it, you cannot trust it.
ProcessCommandLine: the full command line used to launch the process. This is the highest-value field for detection engineering. Malicious PowerShell encodes commands in base64. Mimikatz includes characteristic parameters. LOLBins have specific argument patterns when used maliciously (certutil -decode, mshta with a URL, rundll32 with comsvcs.dll).
InitiatingProcessFileName and InitiatingProcessCommandLine: the parent process that created this process. Parent-child relationships are the core of behavioral detection: Word spawning PowerShell is suspicious. svchost spawning cmd is suspicious. explorer spawning an unsigned binary from %TEMP% is suspicious.
FileName and FolderPath, what binary was executed and from where. Binaries running from temp directories, user profile paths, or recycler folders are more suspicious than binaries in Program Files.
AccountName and AccountDomain, which user account launched the process. Administrative tools run by standard users, or system processes run by non-system accounts, are anomalous.
// Example: Find processes launched from suspicious locations
DeviceProcessEvents
| where Timestamp > ago(24h)
| where FolderPath has_any ("\\Temp\\", "\\AppData\\Local\\Temp\\", "\\Downloads\\", "\\ProgramData\\")
| where FileName endswith ".exe"
| where not(FileName in~ ("msiexec.exe", "setup.exe", "install.exe", "update.exe"))
| summarize count() by FileName, FolderPath, InitiatingProcessFileName, DeviceName
| sort by count_ desc
Essential joins between tables:
Process → Network: a process creates a network connection. Join DeviceProcessEvents with DeviceNetworkEvents on DeviceId and InitiatingProcessId to find: "this process was created AND made an outbound connection to this IP within 30 seconds." This detects: malware that downloads a payload after execution, C2 beacons that establish connections shortly after process creation.
Process → File: a process drops a file. Join DeviceProcessEvents with DeviceFileEvents on DeviceId and InitiatingProcessId to find: "this process was created AND wrote a file to this path." This detects: droppers that create payloads on disk, staging activity where tools are placed before execution.
Process → Registry: a process modifies the registry. Join DeviceProcessEvents with DeviceRegistryEvents on DeviceId and InitiatingProcessId to find: "this process was created AND modified this registry key." This detects: persistence establishment immediately after malware execution.
Logon → Process: a logon event followed by process creation. Join DeviceLogonEvents with DeviceProcessEvents on DeviceId and AccountName to find: "this account logged in AND then this suspicious process ran under that account." This detects: lateral movement where the attacker authenticates to a device and then executes their tooling.
Run one query per table to understand its content:
// Process events — what is running?
DeviceProcessEvents
| where Timestamp > ago(1h)
| take 10
| project Timestamp, DeviceName, FileName, ProcessCommandLine, InitiatingProcessFileName
// Network events — what is connecting?
DeviceNetworkEvents
| where Timestamp > ago(1h)
| take 10
| project Timestamp, DeviceName, RemoteIP, RemotePort, InitiatingProcessFileName// File events — what is being created?
DeviceFileEvents
| where Timestamp > ago(1h)
| where ActionType == "FileCreated"
| take 10
| project Timestamp, DeviceName, FileName, FolderPath, InitiatingProcessFileName// Registry events — what is being modified?
DeviceRegistryEvents
| where Timestamp > ago(1h)
| take 10
| project Timestamp, DeviceName, RegistryKey, RegistryValueName, RegistryValueData// Logon events — who is authenticating?
DeviceLogonEvents
| where Timestamp > ago(1h)
| take 10
| project Timestamp, DeviceName, AccountName, LogonType, RemoteDeviceNameFor each result: identify one event that looks normal and one that would warrant investigation. This exercise builds familiarity with the data that your detection rules will query.
Table selection for common investigation scenarios
When building a detection or running a hunt, selecting the right table is the first decision:
- Investigating what processes an attacker ran: DeviceProcessEvents (command lines, parent-child chains, file hashes)
- Investigating where the attacker connected: DeviceNetworkEvents (remote IPs, URLs, ports, initiating process)
- Investigating what files the attacker dropped: DeviceFileEvents (file creation with hash, path, and creating process)
- Investigating what persistence the attacker created: DeviceRegistryEvents (autostart keys, service installations)
- Investigating how the attacker authenticated: DeviceLogonEvents (logon type, source IP, protocol)
- Investigating what DLLs loaded (injection detection): DeviceImageLoadEvents (DLL name, path, signing status)
Each table captures a different aspect of endpoint activity. Multi-step attack chains span multiple tables and require joins (ES9.6). Single-technique detections typically query a single table for better performance.
Understanding the data retention and latency characteristics of each table prevents investigation surprises. MDE Advanced Hunting retains data for thirty days by default (configurable to one hundred and eighty days with the P2 license). Events appear in the tables within five to thirty minutes of occurring on the endpoint, depending on the MDE sensor's upload cycle and cloud processing time. During an active investigation, recent events may not yet be visible in Advanced Hunting. For events from the last few minutes, use the device timeline in the MDE portal (which shows near-real-time data from the sensor) rather than Advanced Hunting queries.
The event volume per table varies significantly by device type. A standard workstation generates approximately one thousand to three thousand process events per day, while a busy server (web server, build server) generates ten thousand to fifty thousand. Network events scale with user activity: a workstation with an active user generates five hundred to two thousand network events daily. File events are the highest volume table because every file creation, modification, and deletion is captured. Understanding these volumes helps write performant queries: always filter by Timestamp first to limit the data scanned, and use specific table queries rather than union across all tables when only one table is needed.
Compliance Context
Most effective endpoint detections use a small set of KQL operators: `where` (filter), `project` (select columns), `summarize` (aggregate), `join` (combine tables), `has`/`contains`/`startswith` (string matching), and `ago()` (time windows). The Mastering KQL course (K0-K14) covers the language comprehensively. But for detection engineering specifically, you need: string matching for command-line analysis, time windowing for multi-step correlation, and basic joins for cross-table queries. The detections in ES8.4-ES8.6 use these operators exclusively. You do not need advanced KQL (machine learning operators, time series analysis) for the 20+ detections built in this module.
Hands-on: explore the tables
Run these queries to understand the data volume and structure in your environment:
// Event volume per table for the last 24 hours
union DeviceProcessEvents, DeviceNetworkEvents, DeviceFileEvents,
    DeviceRegistryEvents, DeviceLogonEvents, DeviceImageLoadEvents
| where Timestamp > ago(1d)
| summarize EventCount = count() by TableName = $table
| sort by EventCount desc
A typical 865-endpoint fleet generates: 500K-2M process events, 200K-1M network events, 1M-5M file events, 100K-500K registry events, and 50K-200K logon events per day. Understanding the volume helps you write performant queries (always filter by Timestamp first to limit the data scanned).
// Schema exploration: what columns are available? DeviceProcessEvents
| getschema  // Sample data: see what real events look like DeviceProcessEvents
| where Timestamp > ago(1h)
| take 5
| project Timestamp, DeviceName, FileName, ProcessCommandLine, InitiatingProcessFileName, AccountName, SHA256
Troubleshooting
"DeviceImageLoadEvents returns very few results compared to other tables." MDE applies volume filtering to image load events on high-activity devices (ES7.10). The table is useful for targeted queries (specific DLLs, specific processes) but may not be comprehensive for fleet-wide DLL inventory. For comprehensive DLL monitoring, complement with Sysmon Event ID 7 (ES11).
"My detection query returns results in Advanced Hunting but the custom detection rule shows 0 alerts." Custom detection rules use a different evaluation context than interactive queries. The rule's time window, entity mapping (which field maps to "device," "user," etc.), and impacted entities configuration must be correct. Verify the entity mapping in the custom detection rule configuration, without correct entity mapping, the rule may evaluate but not generate alerts.
When the SOC transitions from reactive alert triage to proactive hunting, the table selection decision becomes a daily workflow. The analyst selects the table based on the hunt hypothesis: hunting for suspicious processes targets DeviceProcessEvents, hunting for C2 communication targets DeviceNetworkEvents, hunting for data staging targets DeviceFileEvents, and hunting for persistence creation targets DeviceRegistryEvents. The multi-table join queries from ES9.6 combine tables for attack chain reconstruction. Mastering the schema and data characteristics of each table is what transforms an analyst from someone who runs pre-written queries into someone who writes original hunting queries that find novel threats.
The DeviceEvents table (without a suffix) is a catch-all table containing miscellaneous events that do not fit into the specific tables above. It includes ASR events, CFA events, exploit protection events, and other MDE-specific events. Query ActionType to filter: DeviceEvents | where ActionType startswith "Asr" for ASR events.