
Reading width
Wide uses the full column for everything, text, diagrams, code, and exercises. Narrow keeps the standard reading width.
Text size
Scales the body text. Headings and code blocks keep their size.
In this section
0.2 From a Technique to Something You Can Observe
Introduction
Threat intelligence describes attacks in words: a technique, a campaign, a group's habits. A detection reads events. Between the two sits the most important translation in detection engineering, from what an attacker does to what the estate records when they do it, and most weak rules fail at that step rather than in the query.
MITRE ATT&CK is the shared vocabulary for the first half. It catalogs adversary behavior as tactics, techniques and sub-techniques, and since its October 2025 release it has replaced its short detection notes with Detection Strategies and Analytics that point toward the data a defender needs.
It still cannot say what your own logs contain, or which of your administrators do something that looks exactly like the technique on a Tuesday morning.
This lesson takes one technique from this course's month, PowerShell, and follows it down to the records: the attack that used it, the maintenance job that used it the same way, every table the attack touched, and what makes an indicator worth less than a behavior. It ends with how a team chooses where to start, and where the mapping lives in Microsoft Sentinel.
Tactics, Techniques and Procedures
why, how, and exactly howATT&CK organizes behavior in three levels. A tactic is the attacker's goal at that moment: gaining execution, persisting, stealing credentials. A technique is a general way of achieving it, and a sub-technique a more specific one. A procedure is what a particular attacker actually did: the exact program, arguments and sequence on the exact machine.
The release this course's tooling carries, ATT&CK Enterprise 19.2, holds 15 tactics, 222 techniques and 475 sub-techniques. PowerShell is sub-technique T1059.001, under T1059 Command and Scripting Interpreter, under the Execution tactic. MITRE's page for it describes PowerShell being used to download and run code from the internet, sometimes without the code ever touching disk, which is precisely what happened on b.collins's laptop on 27 February.
The levels matter because each one answers a different question for a detection engineer. The tactic says where in an intrusion a rule sits, and therefore what an alert means for response: an execution alert means code is running now, a persistence alert means it will run again.
The technique says which family of behavior to study and which public analytics to borrow from. The procedure is what the rule actually matches, and it is the level where false positives live, because legitimate software uses the same techniques every day.
The level above the procedure is worth reading as a list, because it shows what a rule written for one sub-technique will never see:
PowerShell is one of 13 ways ATT&CK records to run commands through an interpreter, and 2 of them occur in this course's month. A rule for PowerShell says nothing about the Windows command shell, Visual Basic or a Unix shell. That is not a weakness of the rule, only a boundary, and writing it down is how a team knows which siblings still need a rule of their own.
ATT&CK's own detection guidance follows the same shape since version 18. A Detection Strategy describes the behavior to look for in general terms, and Analytics make it specific to a platform and point to the data components that would show it. Both are a starting point. Neither knows which processes your estate runs, which is why the rest of this lesson works on the month's own records.
From the Technique to an Observable
what the estate actually recordedThe technique page says adversaries abuse PowerShell. The first observable question is narrower: when did PowerShell run in a way worth looking at? Attackers often pass their command base64-encoded with -EncodedCommand, which hides the script from anyone reading the command line and survives quoting problems. Searching the month's process events for exactly that:
DeviceProcessEvents
| where FileName =~ "powershell.exe" and ProcessCommandLine has "-EncodedCommand"
| project Timestamp, DeviceName, InitiatingProcessFileName, AccountName,
    ProcessCommandLine
The SPL form searches the same process events in Splunk, with a wildcard on the command line:
index=defender category="AdvancedHunting-DeviceProcessEvents"
    FileName="powershell.exe" ProcessCommandLine="*-EncodedCommand*"
| table _time DeviceName InitiatingProcessFileName AccountName ProcessCommandLine
Five rows come back. One is on b.collins's laptop on 27 February, started by Word. Four are on an application server on 3 March, started by winrshost.exe under the account svc-ansible. Every one of them is PowerShell with an encoded command, so every one of them matches the technique.
Encoding is popular with attackers for practical reasons as much as stealth. A download cradle full of quotes and parentheses breaks easily when it is passed through a macro, a shortcut or a scheduled task, and base64 removes every character that could break it.
Administrators' tools encode for exactly the same reason, which is why the same flag shows up on both sides of the line. PowerShell also accepts the parameter in shortened forms, so a rule that matches only the full word sees only the attackers who typed it in full; Module 10 deals with that.
The observable only exists where something records command lines. Defender for Endpoint records them for every process on a managed device. The Windows Security log records them only when process-creation auditing includes the command line, which is a policy setting many estates never turn on. Module 3 maps which source records what, and this is the first place that map decides whether a rule can exist at all.
That is the gap between a technique and a detection in one result. The observable "PowerShell ran with an encoded command" is real and recorded, and it is not specific enough to alert on. The next step is reading what each row actually did, which for an encoded command means decoding it, and the decoded text is where the two procedures part company.
Same Technique, Two Procedures
the flag is identical; everything around it differsBase64 hides a command; it does not protect it. Decoding the two kinds of row, as UTF-16LE text, shows what each one was for:
The laptop's command creates a web client, downloads a script from 198.51.100.61 and runs it in memory with IEX, a classic download cradle. The server's commands read the state of the web service, install a Windows feature, restart IIS and list recent updates: an automation tool doing configuration management over Windows Remote Management, which is how Ansible manages Windows.
Grouping the same rows by who started PowerShell, and as whom, turns five events into two procedures:
DeviceProcessEvents
| where FileName =~ "powershell.exe" and ProcessCommandLine has "-EncodedCommand"
| summarize Runs = count(), Devices = dcount(DeviceName)
    by InitiatingProcessFileName, AccountName
The Splunk form groups the same events the same way:
index=defender category="AdvancedHunting-DeviceProcessEvents"
    FileName="powershell.exe" ProcessCommandLine="*-EncodedCommand*"
| stats count as runs dc(DeviceName) as devices
    by InitiatingProcessFileName AccountName
One row is a single run by Word under a user account on one laptop. The other is four runs by the remote management host under one service account, on one server, within three minutes. Read as procedures, the month's encoded PowerShell is one attack and one maintenance job, and the grouping says so before anyone decodes anything.
The flag that matched them, -EncodedCommand, says nothing about which is which. What does is the context around it. A document application, Word, starting a shell is a procedure with almost no legitimate use on a user's laptop.
A remote management host starting a shell under a named service account, on a server, is what that service exists to do. Parent process, account and host are all in the same row the query already returned.
This is the general lesson of procedures. Detections that stop at the technique produce look-alikes by design, because the technique describes a capability that defenders and administrators use too. Detections written at the procedure level, with the context that makes the behavior suspicious, are the ones that stay quiet on a maintenance window. Module 2 calls those distinguishing facts the rule's discriminators.
One Procedure, Seven Records
every table the attack touchedA procedure is more than one event. The attack on b.collins's laptop started with an email and ended with a program running from AppData, and along the way it was recorded by five different services:
The process records alone already tell most of the story, read as a chain from parent to child:
DeviceProcessEvents
| where DeviceName startswith "ne-collins-lt"
| where Timestamp between (datetime(2026-02-27 14:00) .. datetime(2026-02-27 14:10))
| project Timestamp, InitiatingProcessFileName, FileName, AccountName
| order by Timestamp asc
The Splunk view returns the same chain from the Defender events forwarded to it:
index=defender category="AdvancedHunting-DeviceProcessEvents"
    DeviceName="ne-collins-lt*"
    earliest="02/27/2026:14:00:00" latest="02/27/2026:14:10:00"
| table _time InitiatingProcessFileName FileName AccountName
| sort _time
Outlook opened the attachment in Word, Word started PowerShell, PowerShell started rundll32.exe, and rundll32.exe started a program from the user's AppData folder. Every link is a parent and a child in one row, which is why process lineage is the backbone of endpoint detection: the attack is visible as a shape, not only as individual events.
Each record is a place a rule could stand, and each one costs something different. The email record arrives first but cannot see the macro run. The process records catch the execution itself, which is the most specific evidence, but only on devices with an endpoint agent.
The DNS and firewall records see the download from the network, for every device including those without an agent, but say nothing about which process asked. The file record catches what was left behind.
Choosing where to detect is therefore part of the translation, not an afterthought. A rule on the process records is precise and narrow; a rule on the DNS records is broad and noisier; a rule joining the email to the process that followed is the most convincing and the most fragile, because it depends on two sources both arriving.
Module 3 maps what each source records, and Module 8 builds the rules that join them.
The timeline also shows how little time a defender gets. 13 minutes passed between the email and the click, and 11 seconds between Word opening the document and the DLL arriving on disk. A rule that runs hourly will report this an hour late whatever it matches, which is a scheduling decision Module 9 returns to.
Indicators and Behavior
what an attacker has to change to get past each oneThe attack left indicators: the sender's look-alike domain, the address 198.51.100.61, the download domain cdn-docs-share.net, the DLL's name and hash. Matching on them is the cheapest detection there is, and searching the month's firewall log for the address shows what such a match finds:
CommonSecurityLog
| where DestinationIP == "198.51.100.61"
| summarize Connections = count(), FirstSeen = min(TimeGenerated),
    LastSeen = max(TimeGenerated) by SourceIP
The firewall's SPL view, from the same events:
index=network sourcetype="pan:traffic" dest_ip="198.51.100.61"
| stats count as connections min(_time) as first max(_time) as last by src_ip
Two sources connected to it. The laptop made one connection on 27 February, the cradle's download. The web server, 10.0.1.41, made 916 connections from 9 March onward, every ten minutes: the crontab another intrusion planted for the www-data account, fetching its script from the same server. An indicator from one case found a second case, ten days later, on a machine with no email and no Word.
The indicator feed tells the other half of the story. The workspace's threat intelligence table already held the download domain before the attack:
ThreatIntelIndicators
| where ObservableValue in ("198.51.100.61", "cdn-docs-share.net")
| project TimeGenerated, ObservableKey, ObservableValue, Confidence, ValidUntil
The indicator arrived on 18 February, nine days before the laptop resolved the domain, with a confidence of 75. Nothing matched it against the DNS records, so the knowledge sat in one table while the evidence arrived in another. An indicator feed is only as useful as the rules that join it to the telemetry, which is a correlation problem Module 8 returns to.
That is what indicators are good for: fast, cheap retrospective searches that occasionally find something nobody was looking for. Their weakness is how little it costs to change them:
The behavior at the bottom of that ladder is the hard thing to change. An attacker can buy a new domain in minutes, but a different way of getting code to run from a phishing email means a different intrusion. Detection engineering spends most of its effort at that level, and keeps indicators as a feed that runs alongside the rules rather than as the rules themselves.
Choosing What to Detect First
the narrow end of a very wide funnelNo team writes a rule for every technique. The catalog is too large, much of it does not apply to a given estate, and some of what applies leaves no record the team collects. Threat modeling is the discipline of choosing where to start, and saying why:
Three questions narrow the funnel. Exposure: which techniques can reach this estate at all? A company with no Kubernetes does not start with container escapes; one whose staff open invoices from suppliers every day starts with what arrives by email. Evidence: does the estate record the technique?
A behavior with no telemetry is a logging project before it is a detection project. Value: what does catching it early prevent? Execution and credential access sit early in an intrusion, so a rule there buys more response time than one at impact.
This course's month was built the same way. Its 62 malicious cases cover 34 techniques that a mid-sized company running Microsoft 365, Windows, Linux, Azure and AWS meets in practice, and its 46 look-alikes are the administration and ordinary work that resemble them. Every test set pairs attacks with their look-alikes, which is the threat model written down as data.
Written down for this lesson's technique, the decision fits on one card:
Threat model entry: T1059.001 PowerShell
firstThe card is short on purpose. Its value is that a second person can disagree with a specific line: the exposure is overstated, the evidence is missing on unmanaged laptops, the look-alike list is incomplete. A team that writes these cards for its first twenty techniques has a threat model it can review, rather than a list of rules it inherited.
Threat reports feed the same decision from outside. When a report describes a group using a technique against companies like yours, it raises that technique's exposure; when it names indicators, they go to the indicator feed; when it describes a procedure, it becomes a hypothesis. Module 2 turns one report into requirements this way.
Mapping a Rule in Microsoft Sentinel
the field that feeds the coverage viewEvery analytics rule in Sentinel can carry the ATT&CK tactics and techniques it detects. The field sits on the wizard's first tab, beside the name and severity:
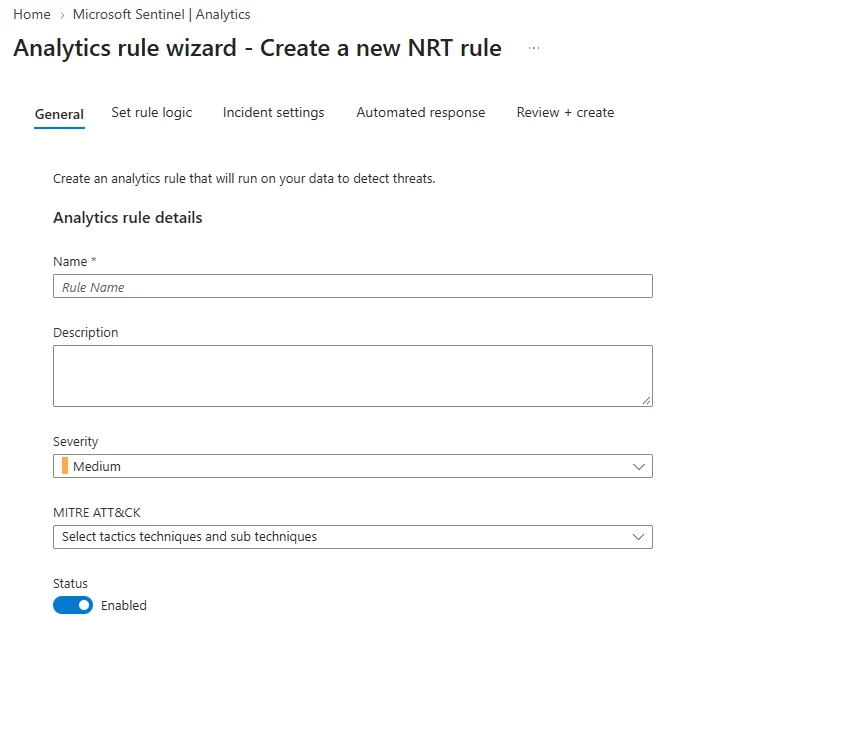
The General tab of the analytics rule wizard. The MITRE ATT&CK selector is where a rule is tied to the technique it was written for. Select the image to open it full size.
Tagging is quick, and it matters for two reasons. It tells the analyst who receives an alert where in an intrusion they are, which shapes the first response. And it feeds Sentinel's ATT&CK view, where each technique tile counts the active rules mapped to it:
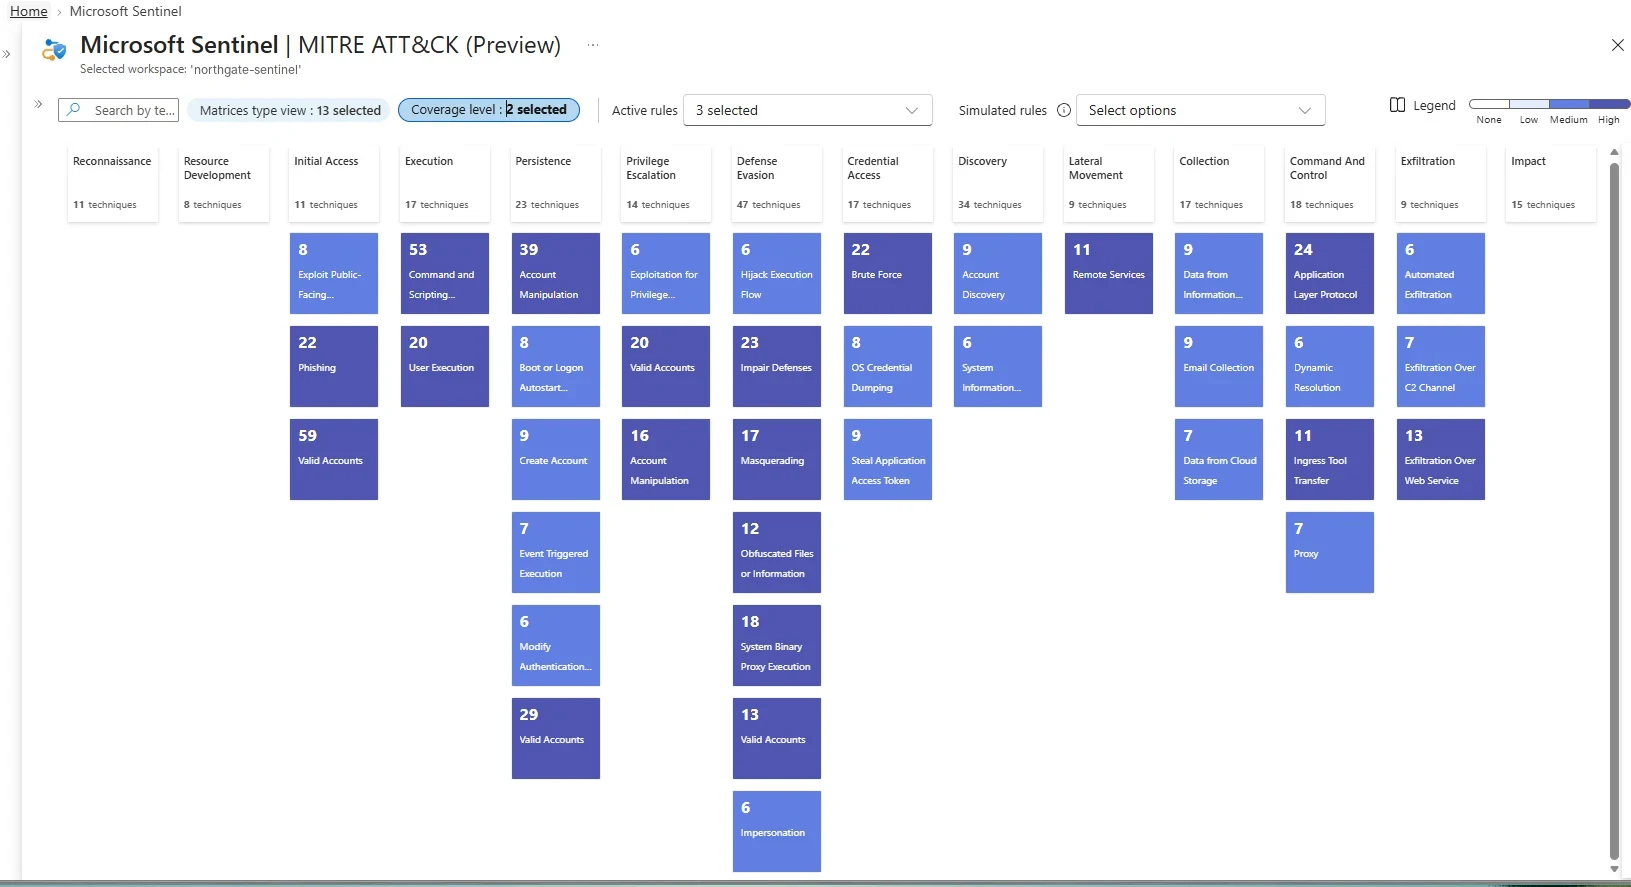
Sentinel's ATT&CK view for a workspace. Each tile counts the active rules mapped to a technique: a statement of intent, not proof that any of them works. Select the image to open it full size.
The view is easy to misread. A shaded tile means someone mapped a rule to that technique, not that the rule would catch any real procedure of it; the PowerShell rule from section two would light up T1059.001 while alerting on Ansible and missing a renamed shell.
Mapped coverage is a list of intentions. Validated coverage, a rule shown on test data to catch a named procedure, is the number worth reporting, and Module 18 builds the board that keeps the two apart.
The rule type matters as much as the tag. The screenshot above is a near-real-time rule, which Microsoft runs once every minute over the events ingested in the previous minute, instead of on a schedule.
That suits a rule like this one, where minutes count, but the type comes with limits on how many such rules a workspace can hold and what the query may do. Microsoft now steers new rules toward custom detections in the Defender portal as well. Choosing between them is part of Module 9.
Two mapping mistakes are common. Tagging a rule with every technique it might conceivably touch makes the matrix look full and the alerts less informative; tag what the rule was written and tested to detect. And tagging only the technique, not the sub-technique, hides the boundary the tree in section one showed: a tile for T1059 looks covered even when only PowerShell is.
What Module 2 Builds On It
from a technique page to a written hypothesisModule 2 makes this translation a repeatable method. It starts from a technique page and turns it into observable behavior, then from a threat report into detection requirements, threat-models the estate to choose what to detect first, and ends by mapping a whole intrusion to ATT&CK and writing hypotheses for it. Each step is the one this lesson walked through for PowerShell.
The output of that method is a hypothesis: a statement precise enough to be tested on data. Written from this lesson it looks like this:
A hypothesis written from this lesson
draftEvery field is there for a reason. The technique ties the rule to the shared vocabulary; the procedure says what the rule actually claims; the observable says where; the look-alike names the case that will test it; and the two outcomes say in advance what success and failure would look like.
A hypothesis without a look-alike has not yet met the estate it will run in, and Module 5 will not let a rule proceed without one. Writing the two outcomes in advance also protects against the commonest self-deception in the work: running the query, seeing a result, and deciding afterwards that the result was what the rule was meant to find.
Practice
The exercise below starts with the technique-level rule from section two. Add the one condition that separates the procedures.
- Run the starting rule. Name each alert by its parent process, account and device.
- Decode both commands. Paste the base64 into a decoder as UTF-16LE and read what each one did.
- State the procedure. Write one sentence for the attack and one for the administration, in terms a log can show.
- Add the separating fact. Constrain the parent process and run it on the set: the cradle detected, Ansible quiet.
- Write the hypothesis. Technique, procedure, observable, look-alike, and what each outcome would mean.
ATT&CK names behavior at three levels, and a detection is written at the lowest: the procedure. One technique can cover an attack and a maintenance job; what separates them is the context in the same record. A procedure leaves evidence in several tables, each a different place to stand, and its indicators are cheap to match and cheaper to change.
The next lesson looks at those tables themselves: what each source records, and the shape the data arrives in.