
Reading width
Wide uses the full column for everything, text, diagrams, code, and exercises. Narrow keeps the standard reading width.
Text size
Scales the body text. Headings and code blocks keep their size.
In this section
0.6 Running Rules in Production
Introduction
A rule in a repository is a claim. A rule in production is an experiment that runs every few minutes, against data that arrives late, from sources that stop, under settings that someone can change in the portal.
Most of what goes wrong with detections goes wrong here, after the query was written and tested, and most of it is invisible unless someone reads the records the platform keeps about its own rules.
Northgate ran six scheduled rules in Microsoft Sentinel during the course month, and the workspace kept a record of every run in SentinelHealth and every change in SentinelAudit. This lesson reads those records. Between them they show the five ways a deployed rule fails: on its schedule, on a silent source, on a broken dependency, in what its alerts carry, and in changes nobody reviewed.
A Month of Runs
what the platform records about its own rulesEvery time a scheduled rule runs, Sentinel writes a health record: when it ran, the window of data it read, how many rows the query returned, how many alerts it raised, and whether it succeeded. Summed over the month, those records are the plainest account of what each rule did:
SentinelHealth
| extend P = parse_json(ExtendedProperties)
| summarize Runs = count(), Failed = countif(Status != "Success"),
    ResultRows = sum(toint(P.QueryResultAmount)),
    Alerts = sum(toint(P.AlertsGeneratedAmount))
    by Rule = SentinelResourceName
| order by Runs desc
The 4,606 runs tell five different stories. Access key created, then trail stopped ran 2,603 times, every fifteen minutes, with no failure and no result. Azure change no peer has made raised 89 alerts, far more than one attack in a month could account for. VPN password spray from one address failed on all 24 of its runs and then appears under a new name with one more. Session replayed from a new client failed once, on the morning of an attack.
Of the two left, the document-to-sign-in correlation raised one alert, and the daily risk score returned a row on two of its 27 runs without raising any.
None of that is visible from the analytics rules list, where every rule shows as a scheduled rule with a severity and a status. The list shows configuration. The health records show behavior, and the gap between them is where this lesson works.
Splunk's equivalent is the saved search, with its cron schedule, its dispatch window and its alert condition set in the same place. The vocabulary differs; the questions in the sections below are the same on both platforms.
The records also give the first measure of cost. Every run reads data and uses query capacity, and a rule running every fifteen minutes runs ninety-six times a day whether or not anything happens.
That is a fair price for a rule that catches something on its schedule. Section two shows the price paid for a rule that could not, and Module 16 returns to the budget a workspace has for scheduled queries.
The Schedule, the Window and the Late Record
why a correct query missed its attackA scheduled rule has three timing settings: how often it runs, how far back it looks, and a short delay the platform adds before each run. Sentinel ran every one of Northgate's rules five minutes after the end of the window it read. The window is defined by event time, TimeGenerated, but the query can only see rows that have arrived in the workspace when it starts.
Access key created, then trail stopped looks for an AWS access key created and CloudTrail stopped within thirty minutes by the same identity: the backdoor pattern from the leaked-key intrusion on 13 March. The attack happened exactly as the rule describes. The records did not arrive in order:
AWSCloudTrail
| where UserIdentityArn endswith "user/t.quinlan"
    and EventName in ("CreateAccessKey", "StopLogging")
| extend Arrived = todatetime(_TimeReceived),
    LateSeconds = datetime_diff("second", todatetime(_TimeReceived), TimeGenerated)
| project TimeGenerated, Arrived, LateSeconds, EventName
The key was created at 04:53:28 and its record arrived 725 seconds later. The stop came forty seconds after the key and arrived first. The rule's health records for those minutes show what each run saw:
SentinelHealth
| where SentinelResourceName == "Access key created, then trail stopped"
| where TimeGenerated between (datetime(2026-03-13 04:50)
    .. datetime(2026-03-13 05:40))
| extend P = parse_json(ExtendedProperties)
| project TimeGenerated, Status,
    WindowStart = todatetime(P.QueryStartTimeUTC),
    WindowEnd = todatetime(P.QueryEndTimeUTC),
    Started = todatetime(P.executionStart),
    Rows = toint(P.QueryResultAmount)
The run for 04:45 to 05:00 started at 05:05:00. The stop record was there; the key record arrived at 05:05:33, thirty-three seconds later. The next run read 05:00 to 05:15, a window neither event falls in, so no run ever held both:
The query was right. The schedule could not see it. Replaying the same rule over the month on two schedules makes the trade explicit:
The same rule, two schedules, replayed over the month
scheduler modelA lookback wider than the frequency gives late records a second and third chance to be read alongside the rest, at the cost of reading the same rows more than once. Module 9 sets frequency, lookback, threshold and suppression together for exactly this reason: each one changes what the others mean.
The same reasoning applies to every source that arrives late. Lesson 0.3 showed a collector holding the VPN appliance's events for over four hours, and cloud audit trails routinely deliver records minutes after the event.
A rule's lookback has to be wider than its frequency by at least the lateness its sources show, and that lateness has to be measured from the data, as the query above does, rather than assumed from a vendor's documentation.
Success Is Not the Same as Working
a rule that kept running after its source diedThe same intrusion that defeated Access key created, then trail stopped's schedule also stopped CloudTrail in the production account. After the last event the trail delivered, the rule kept running:
let TrailLast = toscalar(AWSCloudTrail
    | where RecipientAccountId == "418295607314"
    | summarize max(TimeGenerated));
SentinelHealth
| where SentinelResourceName == "Access key created, then trail stopped"
    and TimeGenerated > TrailLast
| summarize RunsAfter = count(), Succeeded = countif(Status == "Success"),
    ResultRows = sum(toint(parse_json(ExtendedProperties).QueryResultAmount))
| extend TrailLastEvent = TrailLast
220 more runs, every one of them a success and every one returning nothing. From the rule's point of view nothing was wrong: the query parsed, the table existed, and an empty result is a valid result.
Sentinel's health records describe a run like this as a success because it is one. The rule was not broken. It was blind, and the record of a blind rule looks identical to the record of a rule watching a quiet estate.
That is the most important single fact about running detections. A rule's health can only report on the rule. Whether the source it reads is still delivering is a separate question that needs its own check, per source and per host or account, against that source's normal rhythm.
Lesson 0.3 showed the faults that cause silence; Module 18 builds the check that notices it and ties each silent source to the rules it blinds.
There is a second lesson in the same records. An attacker who stops logging has made a move that is itself detectable: StopLogging is a single CloudTrail event, and it arrived in the workspace before the trail went quiet.
A rule on that one event would have fired on the first run after it arrived. Detecting the act of blinding is often easier than detecting what comes after it, and Module 18 treats a source going silent as an alert in its own right.
It also explains why a quiet month proves little. A rule that raised nothing for thirty days might be watching an estate where nothing happened, or a source that stopped on day twelve. The only way to tell those apart is to look underneath the rule at the data it depends on.
Failures the Platform Reports
a missing function and an automatic disableNot every failure is silent. Some the platform records loudly, as runs that did not complete:
SentinelHealth
| where Status != "Success"
| summarize Runs = count(), FirstSeen = min(TimeGenerated),
    LastSeen = max(TimeGenerated)
    by SentinelResourceName, Reason
VPN password spray from one address was written against _Im_Authentication, the unifying ASIM parser for authentication events from lesson 0.3, in a workspace where the ASIM parsers were never deployed. Every run failed with the same reason: a function called by the query was not found. After 24 consecutive failures Sentinel disabled the rule, prefixed AUTO DISABLED to its name and recorded one last run that did not execute. The VPN spray it was written to catch happened later in the month, with no rule watching.
Sentinel separates transient failures, which it retries and never disables a rule for, from permanent ones like a missing function, a missing table or a query that no longer parses. A permanent failure repeated enough times switches the rule off.
The renamed rule is easy to miss: it still appears in the rules list, it is just no longer enabled. A team that reads its health records daily sees the failures accumulating; a team that reads only its alert queue sees nothing, because a rule that never runs never raises anything.
The health workbook puts the records on one screen:
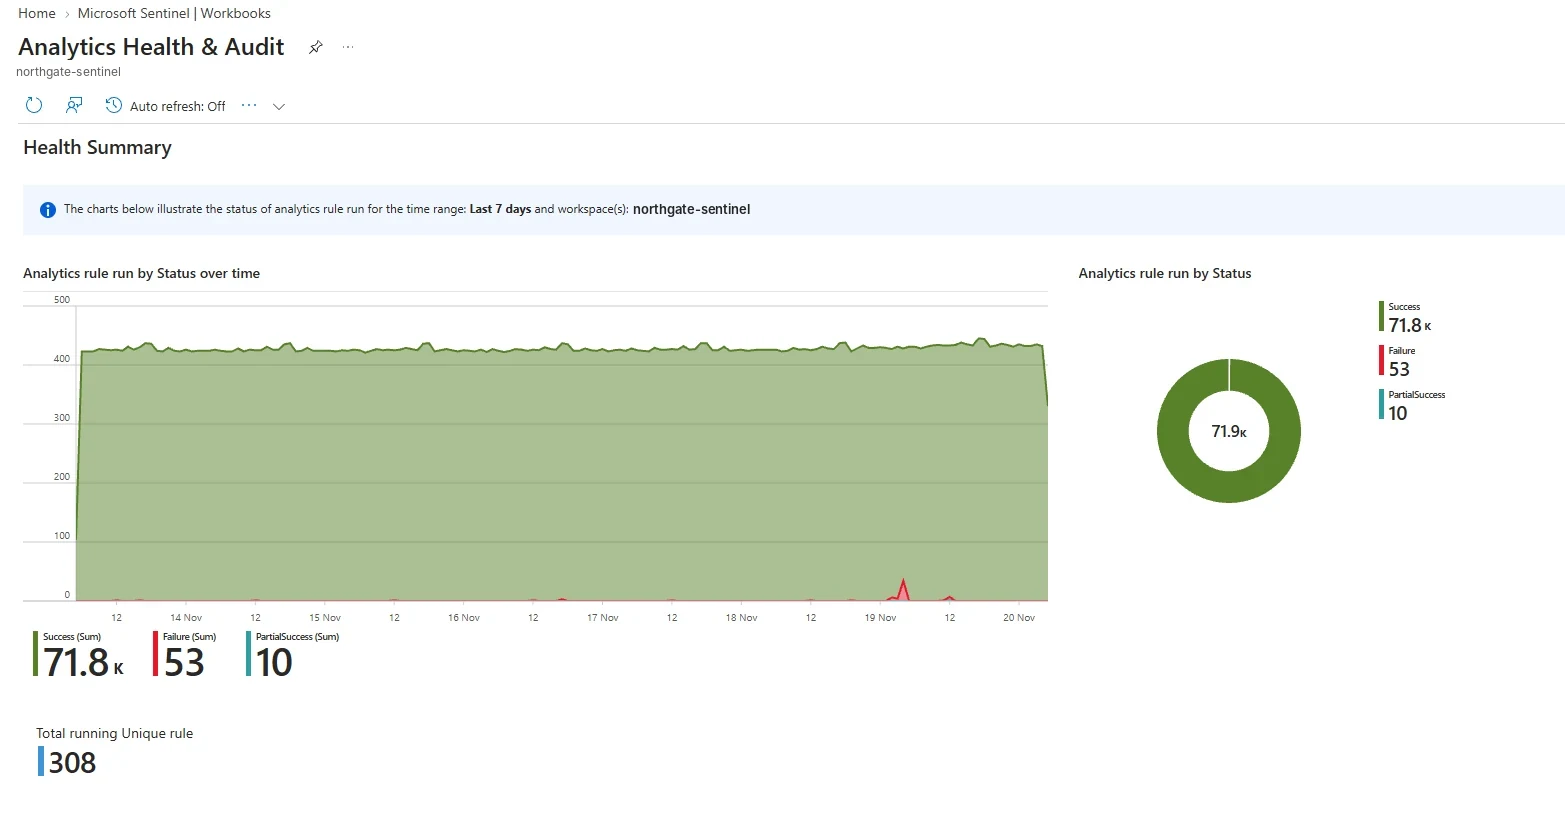
The health workbook at the scale of a large rule set: a week of runs. Failures stand out; a rule that succeeds on no data is one more green point among thousands. Select the image to open it full size.
At scale, one failing rule is a thin red line under a wall of green, and a blind rule is invisible in it. The records are only kept once health monitoring is turned on:
SentinelHealth
| where SentinelResourceType == "Analytics Rule"
| summarize count() by SentinelResourceName, StatusThe dependency that broke VPN password spray from one address is common. Rules call functions, read watchlists, join to reference tables and rely on parsers and connectors, and any of those can be missing in the workspace a rule is deployed to even though it existed where the rule was written. Module 9 promotes rules between environments with that in mind, checking each dependency before a rule is enabled.
From a Result Row to an Alert
entities, details and groupingA query returns rows. What reaches an analyst is an alert, built from those rows by the rule's settings:
From result rows to something an analyst picks up
rule settingsEntity mapping is the setting that matters most downstream. It tells Sentinel which columns identify an account, a host, an IP address or a file, so that alerts can be correlated, incidents grouped and investigations pivoted. It is configured per rule, column by column:
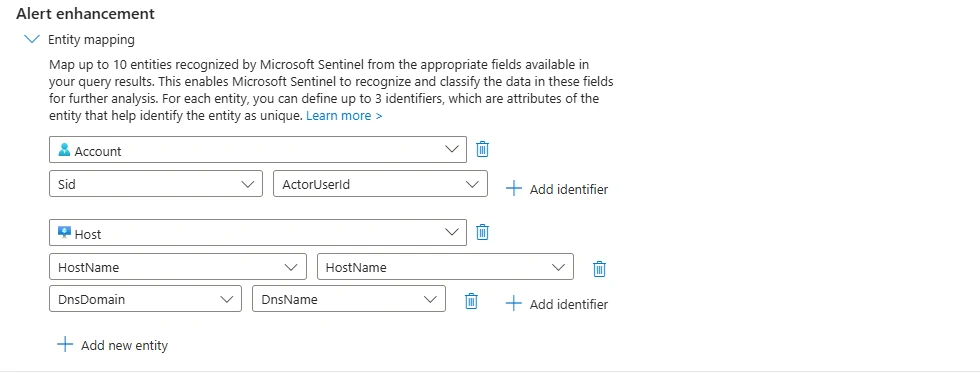
Entity mapping in a rule: each entity type takes up to three identifiers, each read from a column the query returns. A column that is missing or empty in a result row means that entity is dropped from the alert. Select the image to open it full size.
When a mapped column is empty or missing in a result row, the entity is dropped. That happened once in the month, to Session replayed from a new client on the morning of the session replay on 25 February:
SentinelHealth
| where SentinelResourceName == "Session replayed from a new client"
| extend P = parse_json(ExtendedProperties)
| where toint(P.EntitiesDroppedDueToMappingIssuesAmount) > 0
| project TimeGenerated, Status, Alerts = toint(P.AlertsGeneratedAmount),
    Entities = toint(P.EntitiesGeneratedAmount),
    Dropped = toint(P.EntitiesDroppedDueToMappingIssuesAmount), Reason
The rule found the replay and raised its alert, and the alert went out with one entity fewer than it should have carried, logged in a second record as a failure to enrich.
An analyst opening that alert would have seen it without the account entity that ties it to everything else the attacker did, and an incident rule grouping alerts by account would have left it on its own. The query was right and the alert was raised; it was still the weakest alert of the month, because of a mapping.
Grouping and suppression decide the alert count. The fifteen-minute schedule with a sixty-minute lookback in section two caught the key once per overlapping run, three alerts for one attack. Without suppression or grouping on the key, an analyst gets three tickets for one event, and on a busier rule that multiplication is the difference between a queue someone reads and one they skim.
Custom details do the opposite job: they put the evidence on the alert.
A spray rule that surfaces the count of accounts and the list of names it saw lets an analyst decide in seconds whether the alert is real, without rerunning the query. Each detail is a column the query already returns, named and attached to the alert, and Module 9 chooses them for each rule on the question the analyst will ask first.
Custom Detections in Defender XDR
the second place rules runSentinel's analytics rules are one engine. Defender XDR has another: custom detection rules, written in the same Kusto language over the Advanced hunting tables, raising alerts into the same queue:
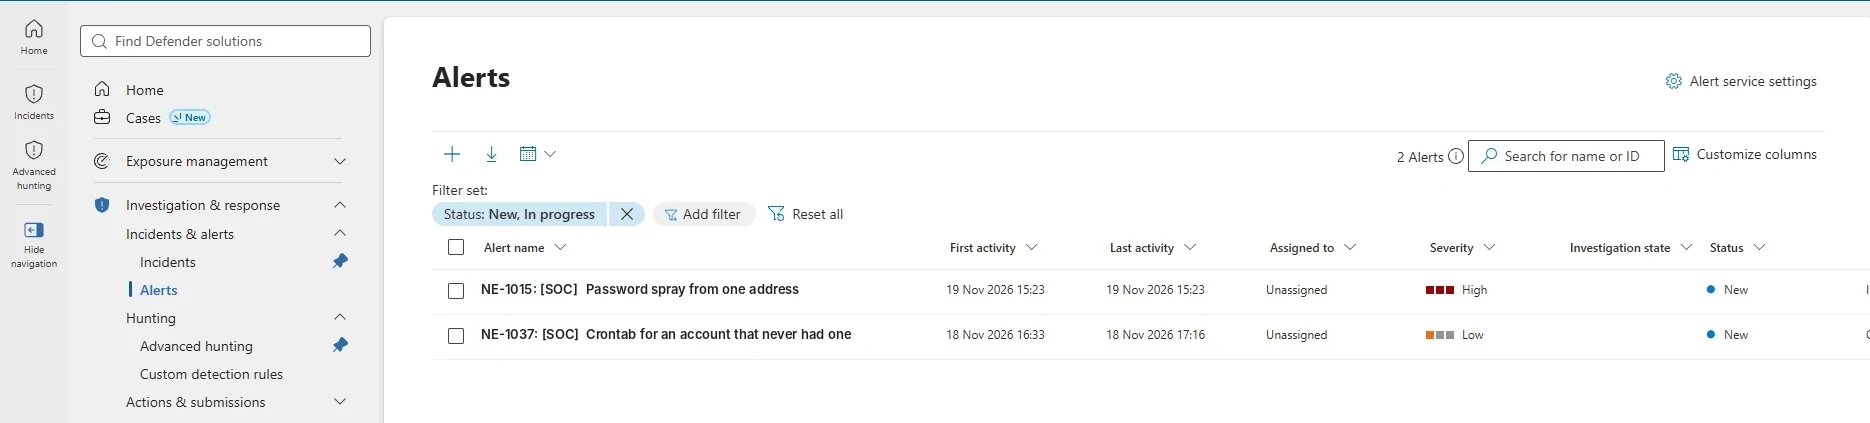
Where a rule's output lands: the Defender portal's alert queue, one row per alert, with the rule's name, severity and first and last activity. The rule's settings decide everything on this row. Select the image to open it full size.
The two engines differ in ways that change how a rule is written.
A custom detection runs on a fixed set of frequencies, every 24, 12, 3 or 1 hours, each with its own fixed lookback, or continuously as events arrive. It applies the lookback itself, so the query should not filter on Timestamp. It needs particular columns in its results for endpoint tables, and it can take a response action on what it finds:
DeviceProcessEvents
| where FileName =~ "vssadmin.exe"
    and ProcessCommandLine has_all ("delete", "shadows")
| project Timestamp, DeviceId, ReportId, DeviceName,
AccountName, ProcessCommandLineThe response action is the reason to choose this engine for some rules. A rule that sees vssadmin delete shadows on a file server can isolate the device in the same minute, before encryption starts. It is also the reason to be careful: an action that fires on a look-alike, the nightly backup job that prunes old shadow copies, takes a production server off the network.
Lesson 0.9 tests rules against exactly those look-alikes, and Module 9 decides which detections are reliable enough to act on their own.
Microsoft is steering new detection work toward custom detections in the Defender portal, as lesson 0.2 noted, and Sentinel rules now surface in the same queue once Sentinel is onboarded there. Module 9 builds a rule in each engine so the differences are learned on real cases rather than from feature lists.
The choice between engines is a design decision, recorded with the rule. Sentinel rules can read every table in the workspace, including third-party sources, and run on any schedule. Custom detections read the Defender tables and can act on what they find. A rule that needs a firewall log and a sign-in belongs in Sentinel; a rule that should isolate a laptop belongs in Defender.
Changes, Owners and Rollback
who changed a rule, and whether anyone reviewed itA deployed rule changes over its life: thresholds move, exclusions are added, lookbacks widen. Every change to an analytics rule is recorded in SentinelAudit, with the identity that made it:
SentinelAudit
| where OperationName == "Microsoft.SecurityInsights/alertRules/Write"
| extend P = parse_json(ExtendedProperties)
| extend Caller = tostring(P.CallerName)
| summarize Writes = count(), Rules = make_set(SentinelResourceName),
    FirstSeen = min(TimeGenerated), LastSeen = max(TimeGenerated)
    by Caller
Northgate deploys its rules from a repository through a pipeline, an application identity that made 8 of the month's writes. Two writes came from people working in the portal.
On 6 March p.sharma narrowed Session replayed from a new client with an exclusion to quiet some noise, a change nobody reviewed and the pipeline never reconciled. On 10 March m.webb turned off incident creation on Azure change no peer has made as an emergency change, and the pipeline redeployed the reviewed version the same afternoon.
The first change is the dangerous one. An exclusion added to quiet a rule is exactly what an attacker would add to blind it, and a change made in the portal leaves the repository describing a rule that no longer exists.
Module 17 builds a detection that flags any write not made by the pipeline and not reconciled by it afterwards; at this level the habit is simpler. Every change gets a record:
A deployment record for one rule change
change logThe rollback line is the one most often missing. A rule redeployed from a reviewed version in a repository can be rolled back in minutes. A rule edited in place can only be rolled back by someone who remembers what it said before, and the audit record shows that it changed, not what it changed from.
Ownership is the other half of the record. Every rule needs a team that answers for it: who tunes it when it is noisy, who fixes it when its source changes, and who decides when it should be retired.
Northgate assigns each rule to the team that owns its data source, because that team is the one that will notice when the source changes. A rule with no owner is a rule nobody will notice failing, and Module 18 starts its inventory from that column.
What Modules 9 and 18 Build On It
implementation, then operationsModule 9 implements rules: a Sentinel scheduled rule with its query, schedule, lookback and threshold set together; a Defender XDR custom detection with a response action; entity mapping, custom details and grouping; promoting a rule between environments with a deployment record and a rollback; and troubleshooting a rule that never fires. Each lesson starts from one of the records in this lesson.
Module 18 runs them as a program: a detection inventory with owners, states and retirement; health checks that catch a rule that went silent and the source behind it; coverage that was tested rather than mapped; and precision, recall and time to detect measured across the library. Together they move a team from what a rule claims to what it does:
The ladder is the habit this lesson leaves. An enabled rule with successful runs has said almost nothing yet. A rule whose source is confirmed alive and whose test cases were caught on its real schedule has said something a team can defend.
Most detection programs stop at the second rung without knowing it. They count enabled rules, map them to ATT&CK, and report coverage from the map.
The records in this lesson show why that number overstates what a team can see: of Northgate's six rules, one never ran, one ran blind for two days, and one missed its attack on its schedule. Module 18 replaces the mapped number with a tested one, and the difference between them is usually the most useful thing a coverage report says.
Practice
The exercise below reads the month's health records. Find the rules that never returned a row, including the one whose runs all succeeded.
- Run the starting query. It lists the rules with failed runs. Note which rule you would have called healthy.
- Count results, not errors. Sum the rows each rule returned across the month.
- Keep the silent ones. A rule with zero results is either quiet for a good reason or blind; you cannot tell which from health alone.
- Check its source. For the rule that ran most, find the last event its table holds from the account it watches.
- Write the verdict. One line per silent rule: failing, blind, or quiet and still useful, and the evidence for each.
A deployed rule is judged by its run records, not its configuration. It can miss an attack on its own schedule, succeed for days on a source that has stopped, be switched off by a missing dependency, raise alerts without the entities that make them useful, or be changed in the portal by someone with a reason and no review.
Each of those leaves a record, and reading them, every week, is part of the work of owning a detection.
The next lesson moves to the endpoint: what Windows and Linux record, and the detections the course builds on them.