
Reading width
Wide uses the full column for everything, text, diagrams, code, and exercises. Narrow keeps the standard reading width.
Text size
Scales the body text. Headings and code blocks keep their size.
In this section
0.3 Telemetry and the Shape of Log Data
Introduction
A detection can only find what something recorded, in the form it was recorded. Both halves of that sentence decide what a rule can do before any query is written. The first is coverage: which sources the estate collects and what each one sees. The second is shape: the field names, formats, identifiers and timing the data arrives with, which differ from source to source and change without warning.
This lesson reads both in the course's month. It starts with what each kind of source answers, then follows one destructive command through three sources that recorded it differently, opens the raw record one of them stores, and works through the faults the month was built to contain: a field that disappeared, a person with two names, duplicated rows and logs that arrived hours late.
Every Source Records a Slice
coverage decides what a rule can seeNo source sees everything. An endpoint agent sees processes, files and connections on the machines it runs on and nothing on the ones it does not. The firewall sees traffic crossing it and none of the traffic inside a subnet.
The identity provider sees sign-ins and directory changes, and nothing about what a signed-in user did on a laptop. Each table in a workspace is one slice of the estate, recorded by one product, for its own purposes.
The month holds 21 tables in seven kinds, and each kind answers a different question:
What each kind of source answers
the month's tablesThe volumes in the figure above follow the same logic. Endpoint tables dominate because every process start, file write and connection on every managed machine is a row, whether it matters or not. Identity and email tables are smaller and denser with meaning per row. Neither size says anything about value: the 78 directory audit rows hold some of the month's most important changes.
In Microsoft Sentinel the slices arrive through data connectors, and the connectors page is the first place to check what a workspace collects:
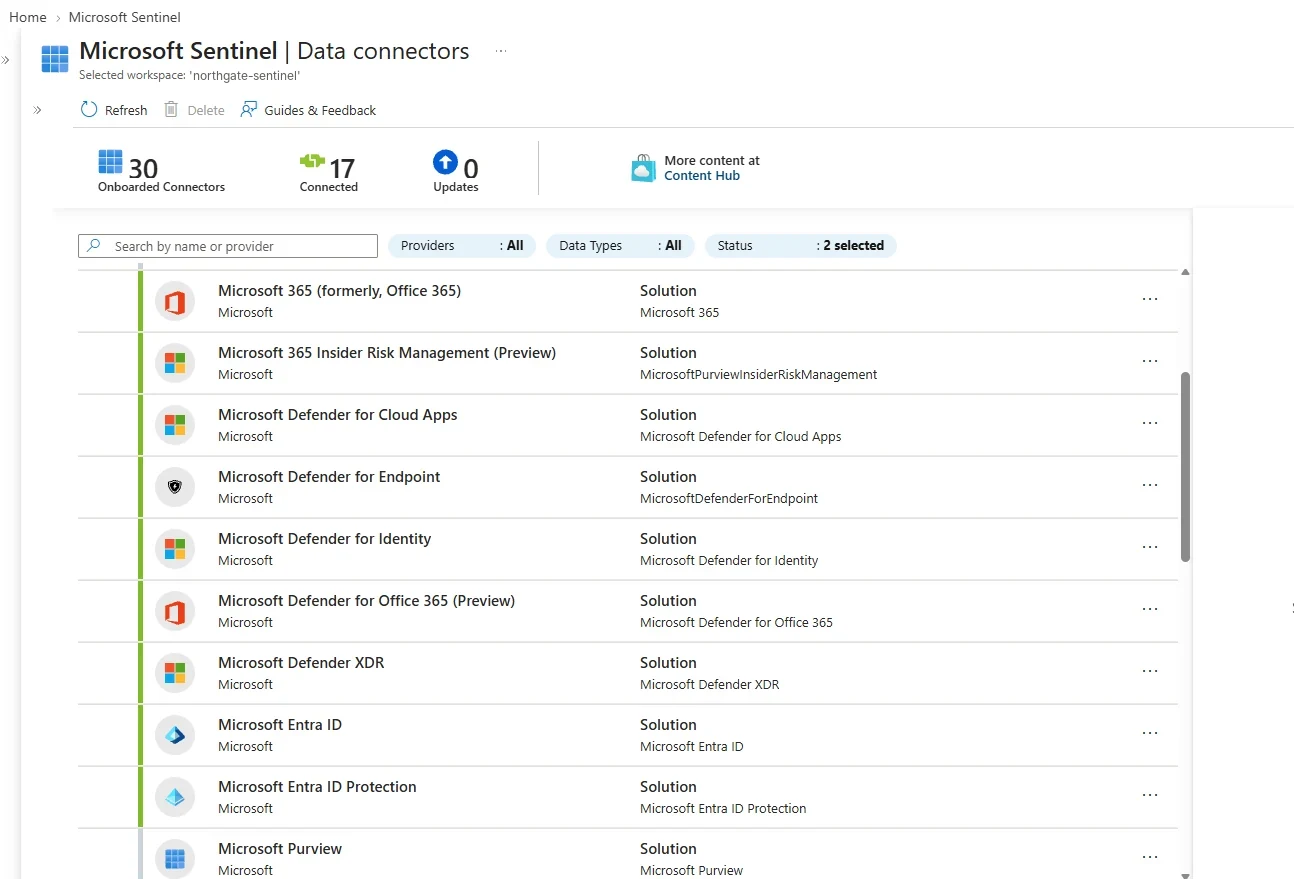
Sentinel's data connectors for a workspace. Each connected line is a table something can query; each disconnected one is a question no rule can answer. Select the image to open it full size.
A connected status means data is arriving, not that it is complete. The only proof a source is flowing is rows in the table, which is why the procedure below ends with a query:
union withsource = Table *
| where TimeGenerated > ago(1h)
| summarize Rows = count() by TableThe last step matters more than the first two. A connector can show as connected while one of the things behind it has stopped sending: a single agent uninstalled, a diagnostic setting deleted, a forwarder full.
The table keeps filling from everything else, so the overall volume barely moves. Detection engineers learn to ask the question per source and per host, not per connector, and section seven shows three ways the month fails that question.
There is a second reason to know the slices before writing rules. A technique is only detectable where some source records the behavior it produces, and the same technique can be visible in one estate and invisible in another. Lesson 0.2 traced a technique to the records it leaves; this lesson asks whether the estate collects those records at all, and in what form.
One Command, Three Records
the same event under three sets of namesOn 15 March at 02:14 an administrator account on the file server ran vssadmin.exe delete shadows /all /quiet, deleting every shadow copy on the machine: the first step of the ransomware preparation the month ends with. Three sources recorded it. One query reads all three, renaming each source's fields to the same names:
union
    (DeviceProcessEvents
    | where DeviceName startswith "srv-nge-mcr-fs01"
    | project TimeGenerated = Timestamp, Source = "Defender",
        Parent = InitiatingProcessFileName, User = AccountName,
        CommandLine = ProcessCommandLine),
    (Event
    | where Source == "Microsoft-Windows-Sysmon" and EventID == 1
        and Computer startswith "srv-nge-mcr-fs01"
    | project TimeGenerated, Source = "Sysmon",
        Parent = extract(@'Name="ParentImage">([^<]+)', 1, EventData),
        User = extract(@'Name="User">([^<]+)', 1, EventData),
        CommandLine = extract(@'Name="CommandLine">([^<]+)', 1, EventData)),
    (SecurityEvent
    | where EventID == 4688 and Computer startswith "srv-nge-mcr-fs01"
    | project TimeGenerated, Source = "Security 4688",
        Parent = ParentProcessName, User = Account, CommandLine)
| where TimeGenerated == datetime(2026-03-15T02:14:00Z)
The Splunk search does the same with coalesce, picking whichever field each source uses:
(index=defender category="AdvancedHunting-DeviceProcessEvents")
OR (index=endpoint EventCode=1
    sourcetype="XmlWinEventLog:Microsoft-Windows-Sysmon/Operational")
OR (index=wineventlog sourcetype="WinEventLog:Security" EventCode=4688)
| eval device=lower(mvindex(split(coalesce(DeviceName, host), "."), 0))
| where device="srv-nge-mcr-fs01" AND _time="2026-03-15T02:14:00.000Z"
| eval source=case(index="defender", "Defender", index="endpoint", "Sysmon",
        true(), "Security 4688"),
    parent=coalesce(InitiatingProcessFileName, ParentImage, Creator_Process_Name),
    account=coalesce(AccountName, user),
    command_line=coalesce(ProcessCommandLine, CommandLine, Process_Command_Line)
| table _time source parent account command_line
All three agree on the command line. They disagree on almost everything else. Defender for Endpoint gives the parent as a file name, cmd.exe, and the user as an account name, a-tquinlan.
Sysmon and the Security log give the parent as a full path, C:\Windows\System32\cmd.exe, and the user with its domain, NE\a-tquinlan. A rule written against one source's field names returns nothing when pointed at another, and a rule comparing values across them has to normalize case, paths and domains first.
The overlap is useful as well as awkward. Three sources recording one command means a rule survives the loss of any one of them, and section seven shows that losses happen. It also means three rules can fire on one event unless someone decides which source each detection reads, a duplication Module 9 deals with when rules are deployed.
Each source also adds its own context. Defender for Endpoint attaches the device's identifiers, the process's file hashes and its own view of the parent chain. Sysmon carries a process GUID that links every later event from the same process. The Security log carries the logon ID that ties the process to the session that started it.
Choosing a source for a rule is therefore not only a question of coverage: it decides which follow-up questions the alert can answer without another query. A rule on vssadmin that reads Defender can hand the analyst a hash and a device ID; the same rule on the Security log hands over a logon session to trace.
The Raw Shape of a Record
fields that are not yet columnsTwo of those sources arrive as tidy columns. The Sysmon record does not. The Windows event pipeline stores Sysmon's fields inside a single XML string, in a column called EventData:
Every field a rule needs, the program, its command line, its parent and its user, is inside that string. To a query they do not exist as columns until something extracts them, which the query in section two did with a regular expression per field. Pulled out the same way for the five minutes around the command:
Event
| where Source == "Microsoft-Windows-Sysmon" and EventID == 1
| where Computer startswith "srv-nge-mcr-fs01"
| where TimeGenerated between (datetime(2026-03-15 02:10)
    .. datetime(2026-03-15 02:15))
| extend Image = extract(@'Name="Image">([^<]+)', 1, EventData),
    CommandLine = extract(@'Name="CommandLine">([^<]+)', 1, EventData)
| project TimeGenerated, Image, CommandLine
Splunk's Windows add-on extracts the same names at search time, so the SPL form simply lists them:
index=endpoint EventCode=1 host="srv-nge-mcr-fs01*"
    sourcetype="XmlWinEventLog:Microsoft-Windows-Sysmon/Operational"
    earliest="03/15/2026:02:10:00" latest="03/15/2026:02:15:00"
| table _time Image CommandLine
Four commands ran in twenty-four seconds: vssadmin deleted the shadow copies, wmic shadowcopy delete tried the same thing through WMI, and two bcdedit commands turned off Windows recovery. The extraction makes each of those a row a rule can match.
Extraction has a cost, though. It runs on every record the query reads, every time the rule runs, which on a busy table is much slower than reading a column. Module 4 shows where to move that work: into a parser function, or into the pipeline before the data is stored.
The raw shape also decides what a careless filter does. A rule that searches the whole EventData string for vssadmin matches the Image field, the CommandLine field and any other field that happens to contain the word, including a parent or a file path.
A rule that extracts CommandLine first and then matches it is precise. The difference is invisible in testing on clean data and visible the first time a backup tool with "vssadmin" in its path runs.
Knowing where the field sits inside the record is what lets a rule match the field rather than the string around it. The same applies to time: the record carries Sysmon's own UtcTime as well as the workspace's TimeGenerated, and the two can differ when a collector is slow, which section seven returns to.
When the Shape Changes
a field that quietly stopped being filledField values are not fixed either. The VPN appliance sends its events as CEF over syslog, and until 3 March the collector tagged each one with the process name CEF. Then the collector agent upgraded itself, and the tag disappeared:
Syslog
| where Computer == "NE-FGT-VPN01"
| extend ProcessName = iff(isempty(ProcessName), "(empty)", ProcessName)
| summarize Rows = count(), FirstSeen = min(TimeGenerated),
    LastSeen = max(TimeGenerated) by ProcessName
The Splunk view of the same appliance shows the same split:
index=network sourcetype=syslog host="NE-FGT-VPN01"
| eval process_name=if(process="CEF", "CEF", "(empty)")
| stats count as rows min(_time) as first_seen max(_time) as last_seen
    by process_name
631 rows carry the tag and 509 carry an empty string, every one of them after the upgrade. The messages themselves are unchanged: each still begins CEF:0|Fortinet|Fortigate|. A rule that filtered on ProcessName == "CEF" worked perfectly until 3 March and then saw nothing from the VPN for the rest of the month, without an error, a warning or a failed run.
This is schema drift, and it is the most dangerous kind of failure because it looks like quiet. Nothing about the rule changed and nothing about the attack it watches for changed; only the shape of the data under it did.
Two habits protect against it: filter on the most stable thing in the record, here the message's own CEF:0|Fortinet| prefix rather than a tag a collector adds, and watch each source's own volume so a sudden silence is noticed. Module 18 builds that watch.
Drift is not rare. Vendors rename fields between versions, collectors change how they tag messages, cloud services add a property or move one into a nested object, and an administrator changes a log format to fix something else. Every one of those changes leaves the old rows untouched and the new ones different, so a query run over the whole month still returns results and looks healthy.
The way to see drift is to compare a source with itself over time, as the query above does by grouping on the field and printing when each value first and last appeared. A value that stops on a date and never returns is the signature.
One Schema for Many Sources
normalization with ASIMEvery source naming the same idea differently is the problem normalization solves. Microsoft's answer in Sentinel is the Advanced Security Information Model, ASIM: a layer between the raw sources and the analyst that maps each source's fields onto one schema per kind of event, so that a query written once works across products.
The month's DNS data is already in that form. The table ASimDnsActivityLogs uses ASIM's DNS schema, with field names that would be identical whichever DNS server produced them:
ASimDnsActivityLogs
| summarize Queries = count(), Clients = dcount(SrcIpAddr)
    by EventVendor, EventProduct, EventSchemaVersion, Dvc
SrcIpAddr is the client, DnsQuery the name asked for, EventProduct and Dvc the server that answered, and EventSchemaVersion the version of the schema the row follows. A rule written against those names keeps working if the organization replaces its DNS servers, adds a cloud resolver or brings in a second company's logs, as long as each source has a parser that fills the schema.
ASIM does most of its work at query time. Its parsers are KQL functions that read the original tables, such as Syslog or CommonSecurityLog, and return rows in the normalized schema; a query calls the unifying parser for a schema instead of a table name.
The trade is flexibility for cost: a parser runs every time it is called, which is why ASIM can also normalize at ingestion into tables like the one above. Module 4 builds a parser for authentication events and shows where each approach fits.
Normalization does not remove the need to know the sources. A parser maps what a source records; it cannot invent a field the source never captured, and a schema field left empty for one product looks exactly like a field with no activity.
A rule written on a normalized schema should still be tested against each source behind it, because the normalized view hides which product produced each row unless the rule keeps EventProduct in its output. The Splunk equivalent is the Common Information Model, with data models in place of parsers, and the same caution applies to both.
One Person, Several Names
identifiers that do not agreePeople are the entity detections join on most, and they are recorded under different identifiers by different systems. Entra ID and Microsoft 365 record the user principal name. Windows records the Active Directory account name, which is usually, but not always, the first half of the UPN. For one engineer in the month it is not:
union
    (SigninLogs | where UserPrincipalName == "j.okonkwo@ne.com"
        | summarize Rows = count() | extend Source = "SigninLogs", Key = "UPN"),
    (OfficeActivity | where UserId == "j.okonkwo@ne.com"
        | summarize Rows = count() | extend Source = "OfficeActivity", Key = "UPN"),
    (DeviceProcessEvents | where AccountName == "j.okonkwo"
        | summarize Rows = count()
        | extend Source = "DeviceProcessEvents", Key = "UPN prefix")
| project Source, Key, Rows
Searched by the obvious name, the endpoint has nothing for j.okonkwo, while sign-ins and Microsoft 365 have plenty. The person was active on their laptop the whole month. The directory explains why:
IdentityInfo
| where AccountUPN == "j.okonkwo@ne.com"
| summarize arg_max(TimeGenerated, *) by AccountObjectId
| project AccountUPN, AccountName, AccountDisplayName, OnPremisesDistinguishedName
The account name is jokonkwo, not j.okonkwo, a naming exception from when the account was created. Searched under that name, the endpoint holds 129 process events for the same person. A rule joining a risky sign-in to the processes that followed on the same user's device would join on the wrong key and find nothing, and the absence would look like a clean result.
The fix is to resolve people through a directory table rather than through string manipulation. IdentityInfo holds the object ID, UPN, account name and display name for each person, and joining through it turns three identifiers back into one person. Module 4 builds that mapping and uses it across five sources.
People are not the only entity with this problem. Devices appear as a short name in one table, a fully qualified name in another and an IP address in the firewall log, and the address changes with DHCP. Applications appear as a display name in sign-ins and an object ID in the audit log.
The query in section two already handled one version of it, splitting device names on the first dot and lowering their case before comparing. Every join between sources rests on deciding which identifier is authoritative and where the mapping between them lives, and a join that silently returns nothing is the most common result of getting it wrong.
Gaps, Duplicates and Late Arrivals
the faults every workspace hasReal telemetry is incomplete, repeated and late, and the month carries all three on purpose so that rules can be tested against them. Duplicates are the simplest. For two hours on 26 February the firewall's forwarder sent every event twice, identical in every field:
CommonSecurityLog
| where TimeGenerated between (datetime(2026-02-26 09:00)
    .. datetime(2026-02-26 11:00))
| summarize Rows = count(),
    DistinctRows = dcount(strcat(TimeGenerated, SourceIP, DestinationIP,
        DestinationPort))
The Splunk view builds the same key from the forwarded firewall fields:
index=network sourcetype="pan:traffic"
    earliest="02/26/2026:09:00:00" latest="02/26/2026:11:00:00"
| eval k=_time."|".src_ip."|".dest_ip."|".dest_port
| stats count as rows dc(k) as distinct_rows
102 rows, 51 distinct. A rule counting connections in that window counts double, and a threshold of 50 is crossed by 25 real connections. Counting distinct keys instead of rows, or removing duplicates before counting, is the defense.
Late arrivals are subtler. On 10 March the log collector SRV-NGE-MCR-LOG01 went offline at 00:30 and reconnected at 06:10, and the events from the two devices behind it, the VPN appliance and a firewall, arrived afterwards with their original timestamps:
Syslog
| where TimeGenerated between (datetime(2026-03-10 00:30)
    .. datetime(2026-03-10 06:10))
| extend DelayMinutes = (_TimeReceived - TimeGenerated) / 1m
| summarize Rows = count(), WorstDelayMinutes = round(max(DelayMinutes), 0)
    by Computer
| order by WorstDelayMinutes desc
The VPN appliance's worst event arrived 275 minutes after it happened; every other syslog host stayed under 3 minutes. A rule that runs hourly and looks back one hour over TimeGenerated had already run for those hours before the events existed in the workspace, and it never ran over them again:
Gaps are the third fault.
On 6 March Sysmon stopped reporting from one laptop for six hours while Defender for Endpoint kept reporting it, so a rule built only on Sysmon was blind there and a rule on Defender was not. Each of these faults has a defense, and each defense is a design decision Modules 3 and 4 make explicit: which source a rule reads, what it counts, and how far back it looks.
None of these faults shows up in a rule's own run history. The rule ran on schedule, returned zero or a few rows, and reported success every time.
That is why the course tests every rule against a corpus that contains the faults on purpose, rather than against clean sample data: a rule that has only seen clean data has never been asked whether it would notice a duplicated hour, a delayed collector or a silent agent.
What Modules 3 and 4 Build On It
coverage, then data engineeringModule 3 is about telemetry: what Windows records when encoded PowerShell runs, what Linux records when an SSH password is guessed, what identity and cloud logs record when an application gains a secret, what network and email telemetry show about a beacon, and the latency, retention and loss that silence a rule. It ends with a coverage assessment for three attacks, built from exactly the slices this lesson described.
Module 4 is about the data itself: parsing a firewall log, normalizing authentication events with ASIM, enriching an alert with user, device and threat intelligence context, resolving one user across five sources, and handling duplicates, late arrivals and schema drift. Every one of those lessons starts from a fault this lesson showed in the month.
Together they set a habit for every rule that follows. Before trusting what a query returns, know which source it reads, what shape that source arrives in, and which of its faults the rule has been tested against. A rule that has never met a duplicate, a renamed field or an hour of missing data has not yet met production.
The practice below is the smallest version of that habit. It asks one question of three sources about one person, and the first answer is wrong for a reason that has nothing to do with the person and everything to do with how each source names them. Getting the right answer means checking the shape before trusting the count.
Practice
The exercise below counts one person in three sources. Fix the branch that uses the wrong identifier.
- Run the starting query. Note which source returns nothing for j.okonkwo, and why that is not evidence of inactivity.
- Look the person up. IdentityInfo holds the UPN, the account name and the display name for the same object.
- Use the right key. Filter the endpoint table on the account name the directory gives you.
- Check your counts. Three sources, each with rows; the endpoint count matches the person's process events.
- Name the general fix. Write one sentence on how a rule that joins identity and endpoint data should resolve a person.
Every source records one slice of the estate, under its own names and in its own shape.
The same command can appear three times with three sets of field names; a record can hide its fields inside one string; a field can stop being filled after an upgrade; a person can have two names; and logs can arrive twice, hours late, or not at all. A rule inherits all of it.
The next lesson writes rules in the course's three languages: KQL, SPL and Sigma.